Notebookcheck Logo

Análise do AMD Ryzen 9 9955HX vs. Intel Core Ultra 9 275HX: A batalha pela CPU mais rápida para jogos

Fire Range vs. Arrow Lake.

Junto com as novas GPUs para laptop RTX 5000, chegaram também as novas CPUs HX da AMD e da Intel. Comparamos o AMD Ryzen 9 9955HX com o Intel Core Ultra 9 275HX e comparamos não apenas o desempenho puro da CPU, mas também o desempenho em jogos em conjunto com a nova GPU para laptop RTX 5090.
O AMD Ryzen 9 9955HX enfrenta o Intel Core Ultra 9 275HX

Tanto a AMD quanto a Nvidia apresentaram seus novos processadores móveis high-end da classe HX, juntamente com as novas GPUs para laptop RTX 5000 da Nvidia GPUs RTX 5000 para laptop. Neste artigo de análise, comparamos o AMD Ryzen 9 9955HX com o Intel Core Ultra 9 275HX.

Além do desempenho bruto da CPU, também analisamos vários benchmarks de sistema e benchmarks de jogos em conjunto com a nova GPU para laptop Nvidia GeForce RTX 5090 de 175 W.

Visão geral: AMD Fire Range vs. Intel Arrow Lake

As novas SKUs da Intel e da AMD foram anunciadas oficialmente na CES 2025, e ambos os fabricantes afirmam oferecer os melhores processadores móveis para aplicativos criativos e jogos.

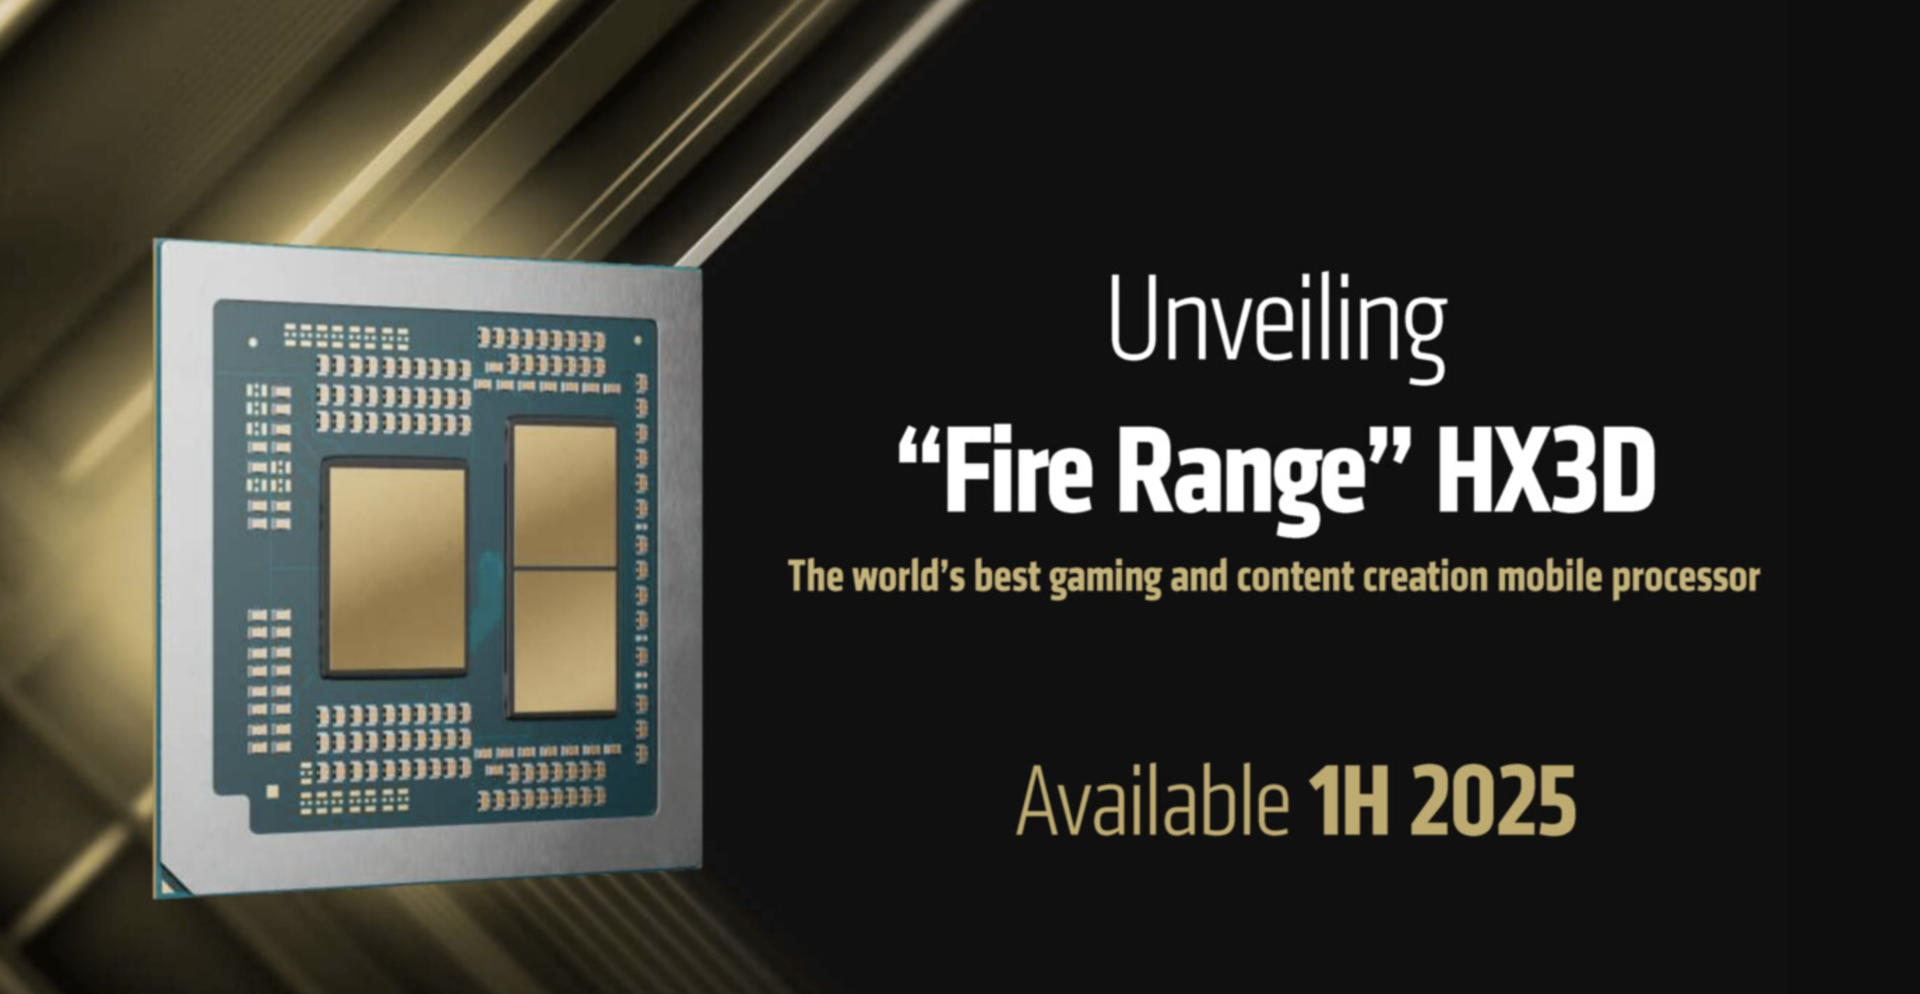
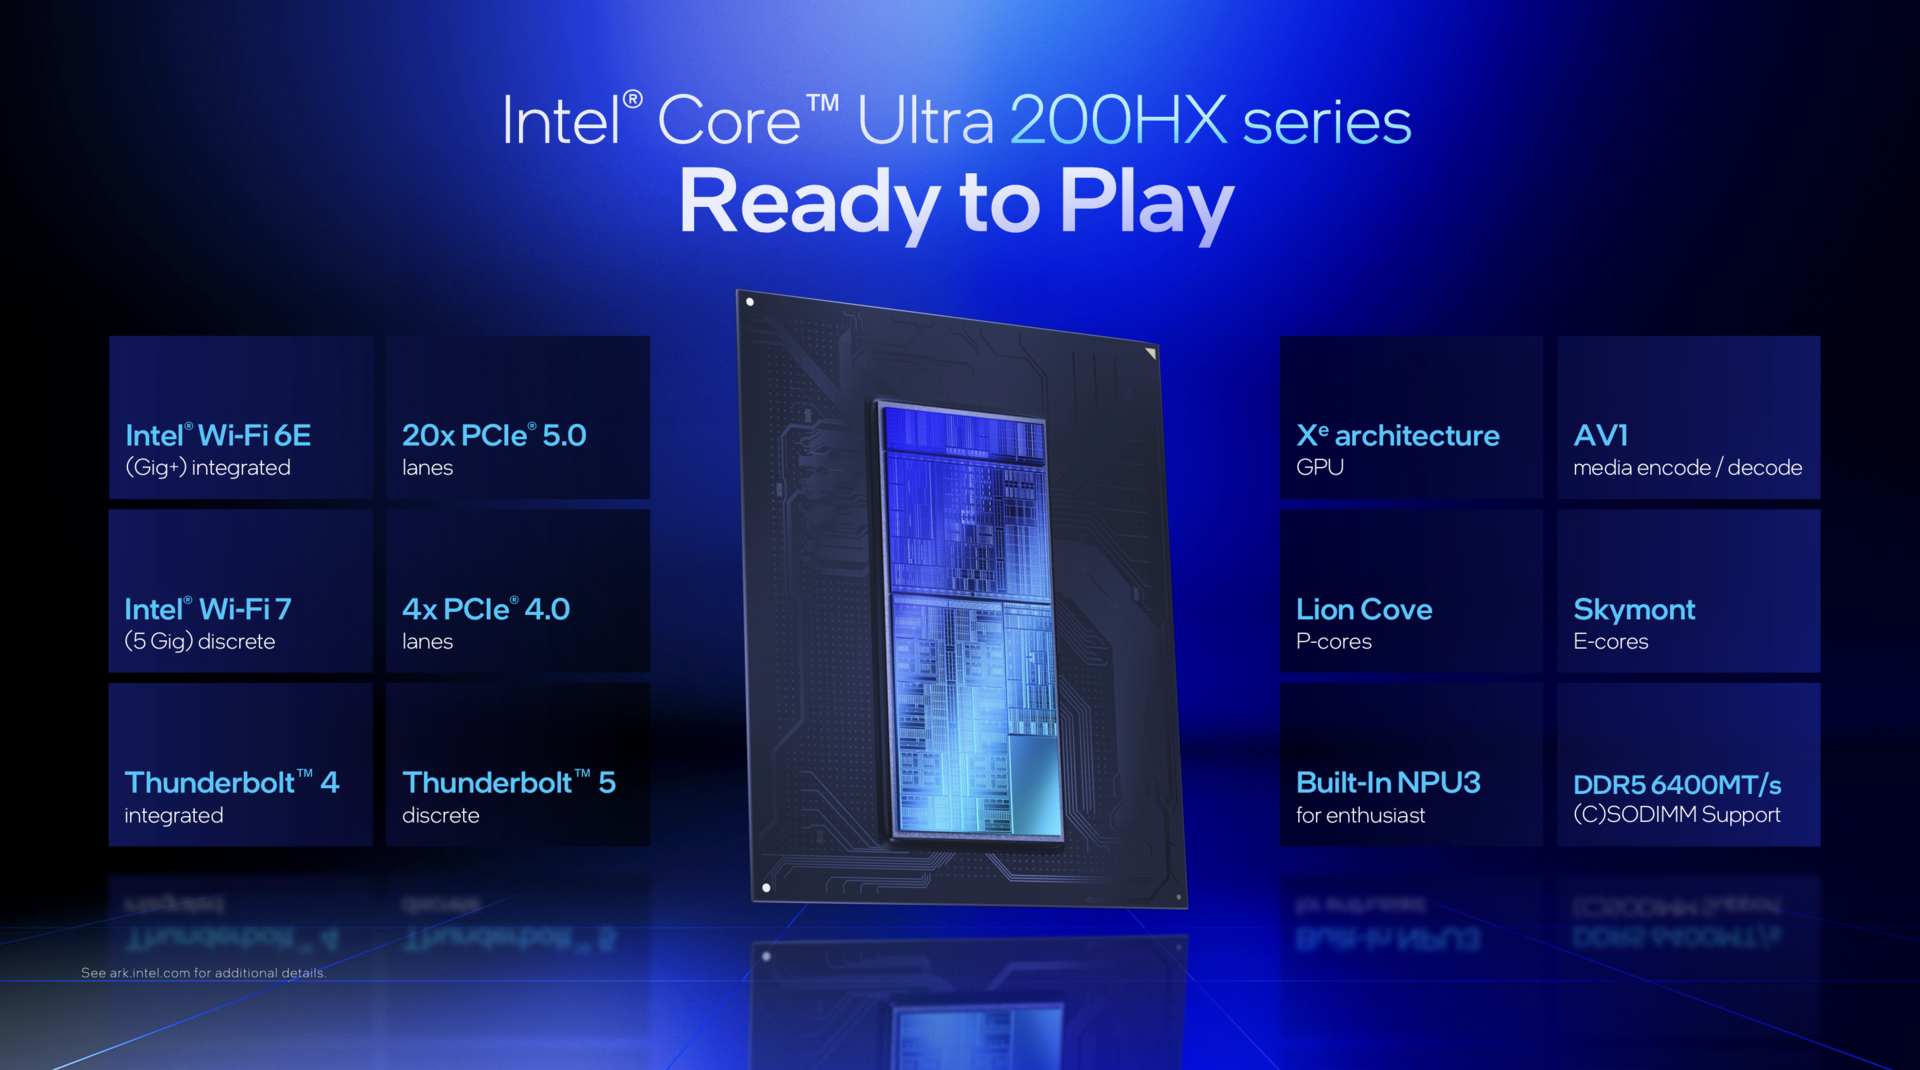
As APUs AMD Fire Range são baseadas nos conhecidos núcleos Zen 5 e uma variante com cache 3D-V também está disponível como opção. A Intel, por outro lado, conta com a arquitetura Arrow Lake.

AMD Fire Range HX
AMD Fire Range HX
Intel Arrow Lake-HX
Intel Arrow Lake-HX

Nossos dois processadores de teste são o AMD Ryzen 9 9955HX e o Intel Core Ultra 9 275HXque não são exatamente os mais rápidos em suas respectivas linhas.

No entanto, é provável que essas duas CPUs sejam usadas com mais frequência em laptops de alto desempenho para jogos/criadores. Em teoria, o TDP das CPUs é de 54 W para a AMD ou 55 W para a Intel, mas sob carga total ambas podem consumir brevemente mais de 150 W.

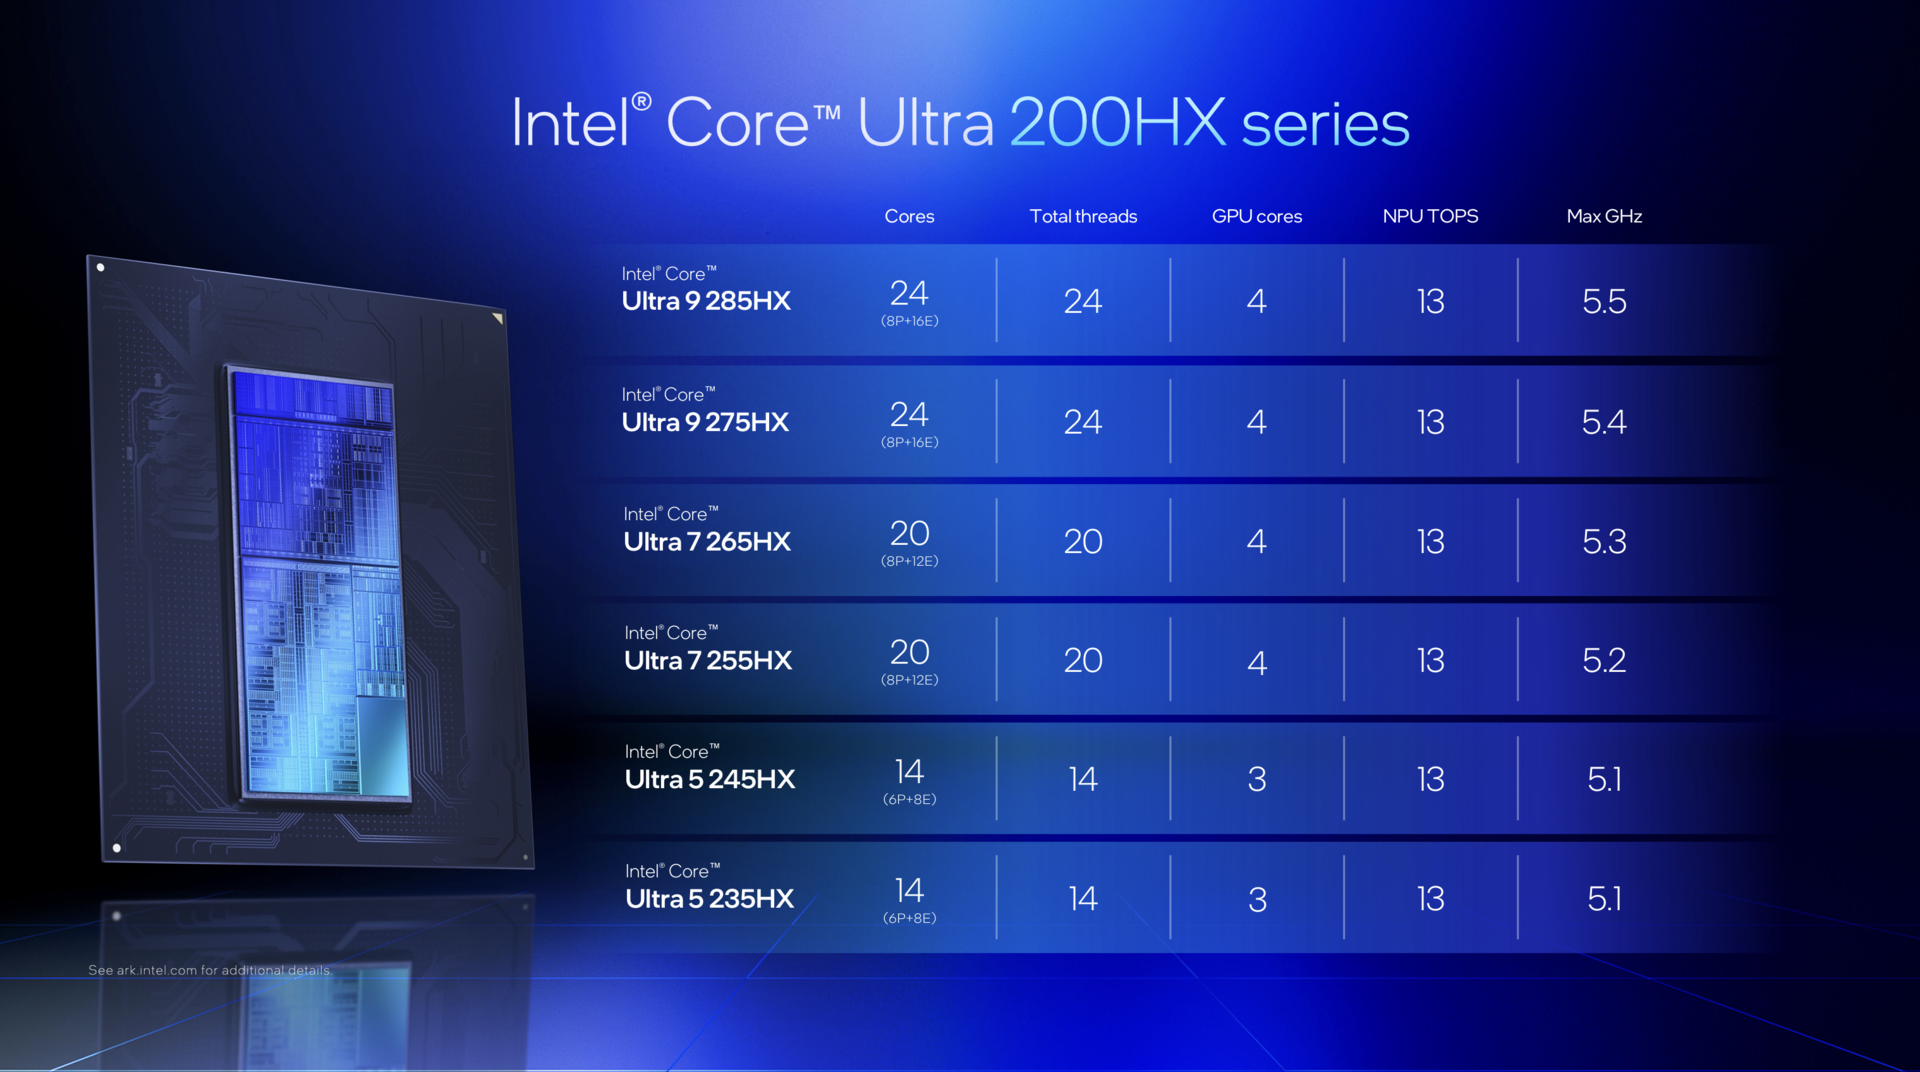
O Ryzen 9 9955HX usa 16 núcleos, incluindo hyperthreading (32 threads), enquanto o Core Ultra 9 275HX usa um total de 24 núcleos (8x Desempenho, 16x Eficiência) sem hyperthreading.

Linha AMD Fire Range 9000HX
Linha Intel Arrow Lake Core Ultra 200HX

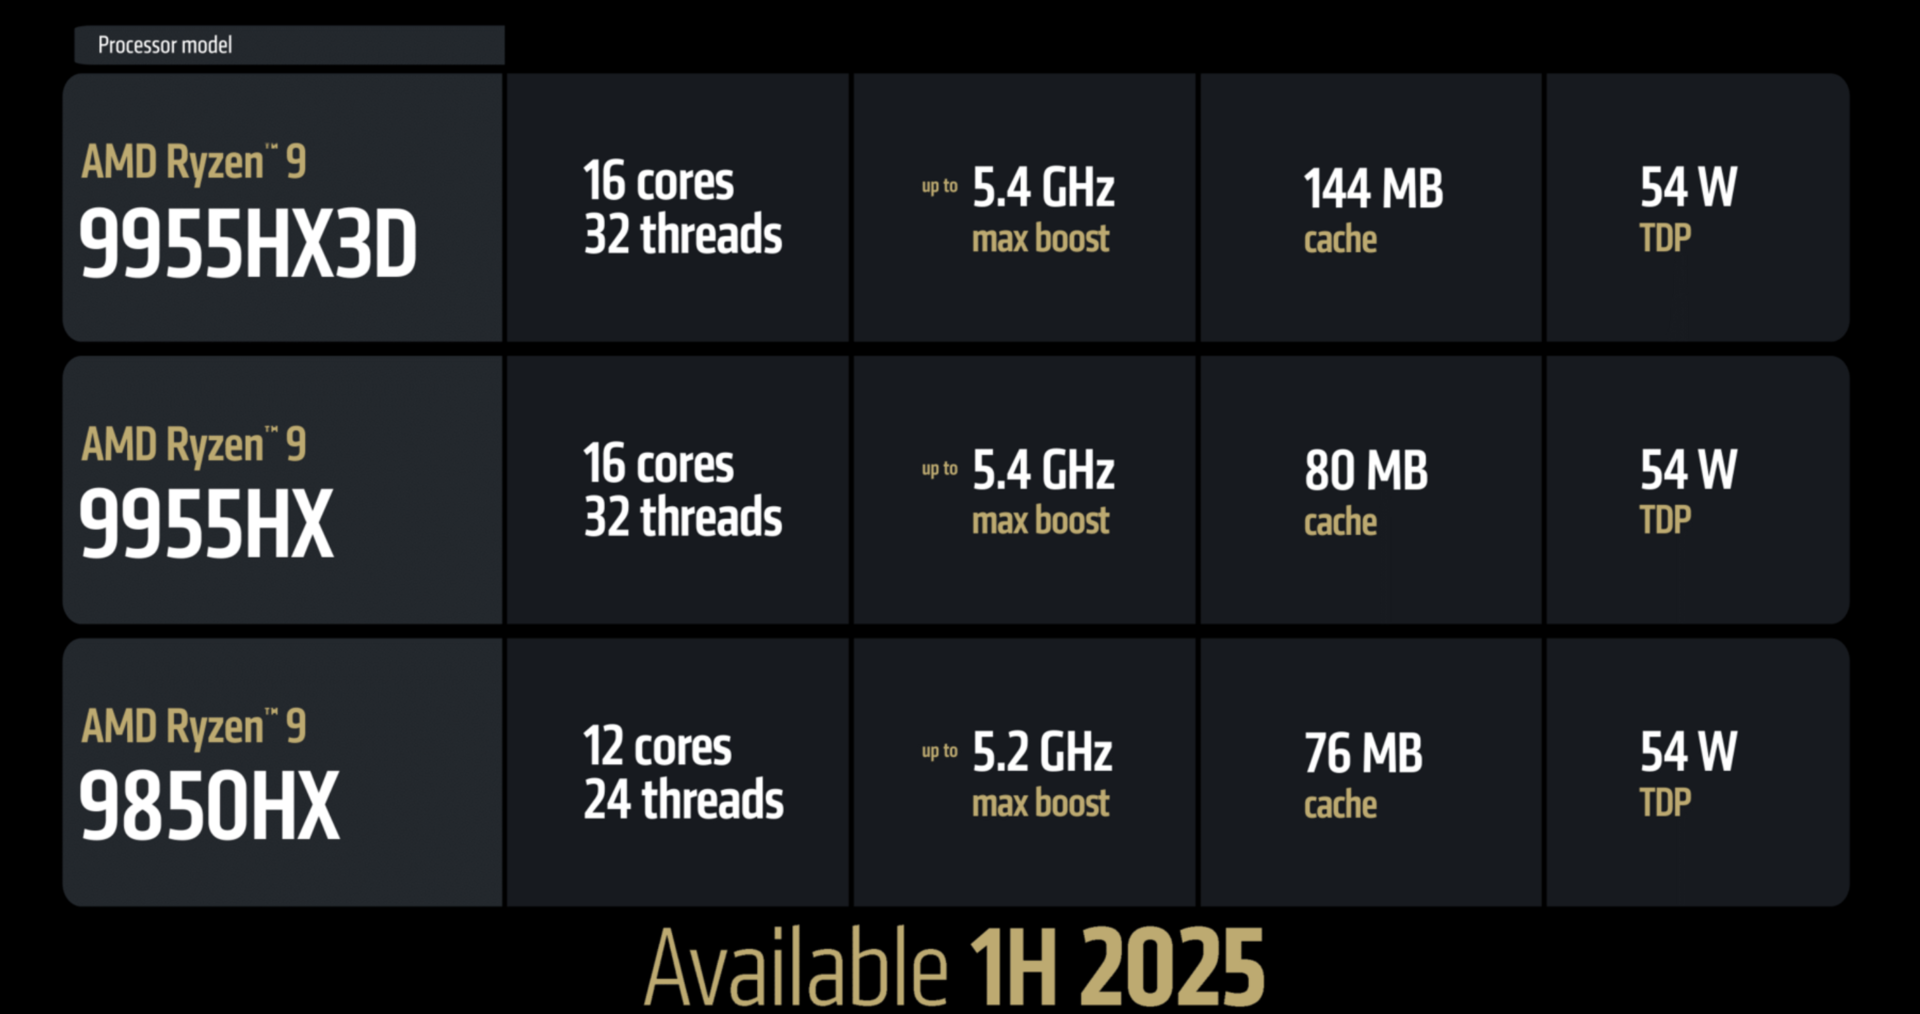
De particular interesse é o Ryzen 9 9955HX3D, que infelizmente ainda não estava disponível para testes. Graças ao 3D V-Cache, ele promete, acima de tudo, um melhor desempenho em jogos, o que já vimos claramente com seu antecessor, o Ryzen 9 7945HX3D. Só podemos esperar que a disponibilidade seja melhor desta vez.

Sistemas de teste: Asus Strix Scar 18 e XMG Neo 16 A25

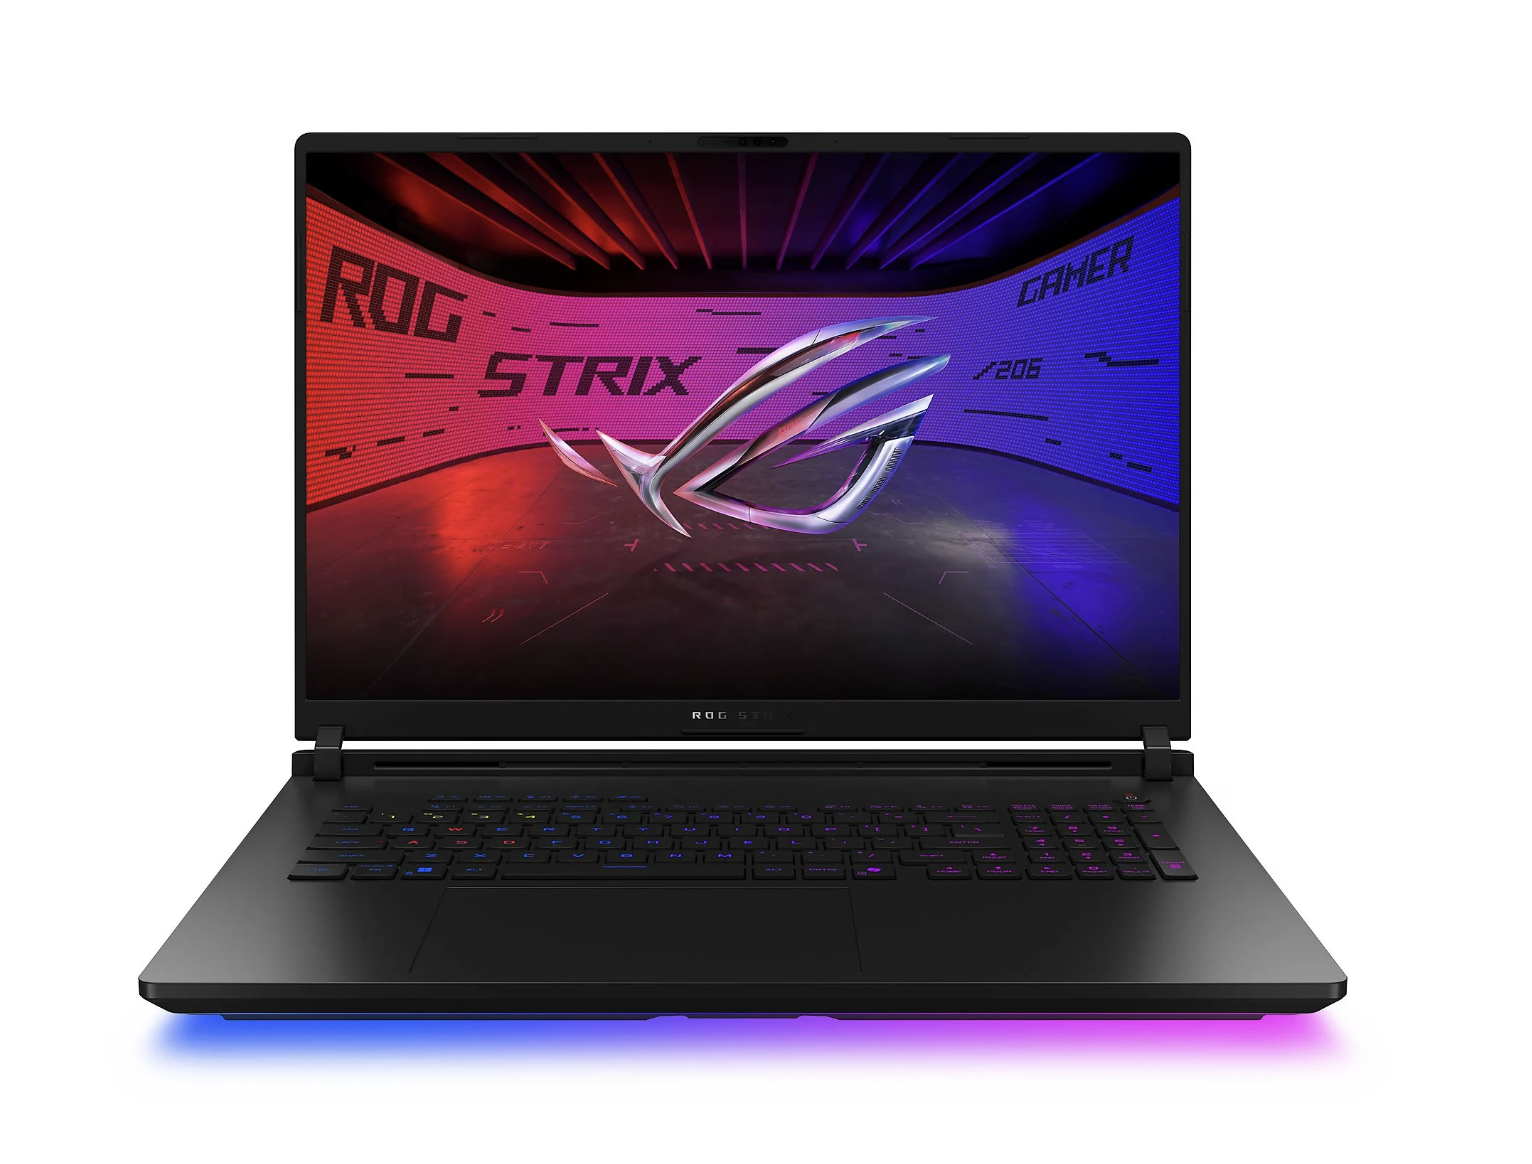
Tínhamos dois notebooks para jogos extremamente potentes à nossa disposição como sistemas de teste. Um deles era o novo Asus ROG Strix SCAR 18 G835LX com o Intel Core Ultra 9 275HX e 64 GB de RAM, e o outro era uma amostra de engenharia do novo XMG Neo 16 A25 com o AMD Ryzen 9 9955HX em combinação com 32 GB de RAM.

Ambos os dispositivos foram equipados com a nova GPU para laptop Nvidia GeForce RTX 5090, que pode consumir até 175 W. Usamos o Nvidia Game Ready Driver 572.84 em ambos os dispositivos, tornando-o ideal para comparações de desempenho.

Asus Strix Scar 18 G835LX
XMG Neo 16 A25
XMG Neo 16 A25

No entanto, neste momento, não faremos medições de consumo prolongado e considerações de eficiência, pois a GPU da Nvidia estava sempre em execução no monitor externo na amostra de engenharia do XMG Neo 16, o que naturalmente aumentaria o consumo de energia e distorceria os resultados de eficiência. Forneceremos esses resultados assim que possível.

Desempenho de um único núcleo

Usamos o Cinebench 2024 e o Geekbench 6 para os benchmarks de CPU, pois esses dois testes são executados nativamente em todas as plataformas e, portanto, permitem uma comparação de desempenho muito boa.

Nos testes de núcleo único, o Core Ultra 9 275HX conseguiu aumentar seu desempenho em cerca de 6% em comparação com o Core i9-14900HX. O Ryzen 9 9955HX, por outro lado, conseguiu aumentar seu desempenho em cerca de 11% em comparação com o Ryzen 9 7945HX e, portanto, alcançou o antigo Core i9-14900HX.

As duas versões móveis também ficaram um pouco atrás de suas respectivas contrapartes para desktop e, como esperado, o Apple ainda tem uma enorme vantagem com a geração M4.

No teste Geekbench, no entanto, a maré muda e o Ryzen 9 9955HX fica ligeiramente à frente do Core Ultra 9 275HX.

Performance Rating - Percent
Apple M4 Max (16 cores)
Apple MacBook Pro 16 M4 Max, M4 Max 40-Core GPU
100 pt
Apple M4 Pro (14 cores)
Apple MacBook Pro 16 2024 M4 Pro, M4 Pro 20-Core GPU
99.4 pt
AMD Ryzen 9 9950X3D
AMD Ryzen 9 9950X3D, NVIDIA GeForce RTX 4090
83.1 pt
Intel Core Ultra 9 285K
Intel Core Ultra 9 285K, NVIDIA GeForce RTX 4090
83.1 pt
Apple M3 Max 16-Core
Apple MacBook Pro 14 2023 M3 Max, M3 Max 40-Core GPU
80 pt
Intel Core Ultra 9 275HX
Asus Strix Scar 18 G835LX, GeForce RTX 5090 Laptop
79.5 pt
AMD Ryzen 9 9955HX
SCHENKER Neo 16 A25 5090 Engineering Sample, GeForce RTX 5090 Laptop
77.9 pt
Intel Core i9-14900HX
MSI Raider 18 HX A14V, NVIDIA GeForce RTX 4080 Laptop GPU
75.3 pt
Intel Core Ultra 9 285H
MSI Prestige 16 AI Evo B2HMG, Arc 140T
73.2 pt
Intel Core i9-13900HK
Beelink GTI13 Ultra, Iris Xe G7 96EUs
71.8 pt
AMD Ryzen AI Max+ 395
Asus ROG Flow Z13 GZ302EA-RU073W, Radeon RX 8060S
71.2 pt
Intel Core i7-14700HX
Lenovo ThinkPad P16 Gen 2, NVIDIA RTX 4000 Ada Generation Laptop GPU
71.2 pt
AMD Ryzen 9 7945HX3D
Asus ROG Strix Scar 17 G733PYV-LL053X, NVIDIA GeForce RTX 4090 Laptop GPU
69.9 pt
AMD Ryzen 9 7945HX
Minisforum BD795i SE, Radeon 610M
69.4 pt
Cinebench 2024 - CPU Single Core
Apple M4 Pro (14 cores)
Apple MacBook Pro 16 2024 M4 Pro, M4 Pro 20-Core GPU
178 Points +38%
Apple M4 Max (16 cores)
Apple MacBook Pro 16 M4 Max, M4 Max 40-Core GPU
178 Points +38%
Intel Core Ultra 9 285K
Intel Core Ultra 9 285K, NVIDIA GeForce RTX 4090
144 Points +12%
Apple M3 Max 16-Core
Apple MacBook Pro 14 2023 M3 Max, M3 Max 40-Core GPU
140 Points +9%
AMD Ryzen 9 9950X3D
AMD Ryzen 9 9950X3D, NVIDIA GeForce RTX 4090
138.4 Points +7%
Intel Core Ultra 9 275HX
Asus Strix Scar 18 G835LX, GeForce RTX 5090 Laptop
138 Points +7%
Intel Core i9-14900HX
MSI Raider 18 HX A14V, NVIDIA GeForce RTX 4080 Laptop GPU
129.9 Points +1%
AMD Ryzen 9 9955HX
SCHENKER Neo 16 A25 5090 Engineering Sample, GeForce RTX 5090 Laptop
129 Points
Intel Core Ultra 9 285H
MSI Prestige 16 AI Evo B2HMG, Arc 140T
127 Points -2%
Intel Core i9-13900HK
Beelink GTI13 Ultra, Iris Xe G7 96EUs
123.5 Points -4%
Intel Core i7-14700HX
Lenovo ThinkPad P16 Gen 2, NVIDIA RTX 4000 Ada Generation Laptop GPU
120.7 Points -6%
AMD Ryzen AI Max+ 395
Asus ROG Flow Z13 GZ302EA-RU073W, Radeon RX 8060S
116.8 Points -9%
AMD Ryzen 9 7945HX
Minisforum BD795i SE, Radeon 610M
116 Points -10%
AMD Ryzen 9 7945HX3D
Asus ROG Strix Scar 17 G733PYV-LL053X, NVIDIA GeForce RTX 4090 Laptop GPU
115 Points -11%
Geekbench 6.4 - Single-Core
Apple M4 Max (16 cores)
Apple MacBook Pro 16 M4 Max, M4 Max 40-Core GPU
3880 Points +20%
Apple M4 Pro (14 cores)
Apple MacBook Pro 16 2024 M4 Pro, M4 Pro 20-Core GPU
3836 Points +19%
AMD Ryzen 9 9950X3D
AMD Ryzen 9 9950X3D, NVIDIA GeForce RTX 4090
3434 Points +6%
Intel Core Ultra 9 285K
Intel Core Ultra 9 285K, NVIDIA GeForce RTX 4090
3306 Points +2%
AMD Ryzen 9 9955HX
SCHENKER Neo 16 A25 5090 Engineering Sample, GeForce RTX 5090 Laptop
3230 Points
Intel Core Ultra 9 275HX
Asus Strix Scar 18 G835LX, GeForce RTX 5090 Laptop
3158 Points -2%
Apple M3 Max 16-Core
Apple MacBook Pro 14 2023 M3 Max, M3 Max 40-Core GPU
3157 Points -2%
Intel Core i9-14900HX
MSI Raider 18 HX A14V, NVIDIA GeForce RTX 4080 Laptop GPU
3010 Points -7%
AMD Ryzen AI Max+ 395
Asus ROG Flow Z13 GZ302EA-RU073W, Radeon RX 8060S
2978 Points -8%
AMD Ryzen 9 7945HX3D
Asus ROG Strix Scar 17 G733PYV-LL053X, NVIDIA GeForce RTX 4090 Laptop GPU
2916 Points -10%
Intel Core Ultra 9 285H
MSI Prestige 16 AI Evo B2HMG, Arc 140T
2912 Points -10%
Intel Core i7-14700HX
Lenovo ThinkPad P16 Gen 2, NVIDIA RTX 4000 Ada Generation Laptop GPU
2892 Points -10%
Intel Core i9-13900HK
Beelink GTI13 Ultra, Iris Xe G7 96EUs
2883 Points -11%
AMD Ryzen 9 7945HX
Minisforum BD795i SE, Radeon 610M
2858 Points -12%

Desempenho de vários núcleos

No multiteste Cinebench 2024, o novo Core Ultra 9 275HX tem um desempenho muito bom e pode superar o antigo Core i9-14900HX em impressionantes 30%. O Ultra 9 275HX também supera por pouco o Apple M4 Max Que, no entanto, exigem muito menos energia.

O Ryzen 9 9955HX está cerca de 15% à frente de seus antecessores e cerca de 7% atrás do 275HX. O multiteste Geekbench mostra um quadro semelhante, com os dois SoCs M4 Max saindo na frente nesse teste.

Performance Rating - Percent
Intel Core Ultra 9 285K
Intel Core Ultra 9 285K, NVIDIA GeForce RTX 4090
92.1 pt
AMD Ryzen 9 9950X3D
AMD Ryzen 9 9950X3D, NVIDIA GeForce RTX 4090
92 pt
Apple M4 Max (16 cores)
Apple MacBook Pro 16 M4 Max, M4 Max 40-Core GPU
91.9 pt
Intel Core Ultra 9 275HX
Asus Strix Scar 18 G835LX, GeForce RTX 5090 Laptop
87.7 pt
AMD Ryzen 9 9955HX
SCHENKER Neo 16 A25 5090 Engineering Sample, GeForce RTX 5090 Laptop
80.2 pt
Apple M4 Pro (14 cores)
Apple MacBook Pro 16 2024 M4 Pro, M4 Pro 20-Core GPU
79.2 pt
AMD Ryzen AI Max+ 395
Asus ROG Flow Z13 GZ302EA-RU073W, Radeon RX 8060S
75.1 pt
Apple M3 Max 16-Core
Apple MacBook Pro 14 2023 M3 Max, M3 Max 40-Core GPU
72.7 pt
AMD Ryzen 9 7945HX
Minisforum BD795i SE, Radeon 610M
69.8 pt
AMD Ryzen 9 7945HX3D
Asus ROG Strix Scar 17 G733PYV-LL053X, NVIDIA GeForce RTX 4090 Laptop GPU
69.3 pt
Intel Core i9-14900HX
MSI Raider 18 HX A14V, NVIDIA GeForce RTX 4080 Laptop GPU
68.2 pt
Intel Core i7-14700HX
Lenovo ThinkPad P16 Gen 2, NVIDIA RTX 4000 Ada Generation Laptop GPU
59.3 pt
Intel Core Ultra 9 285H
MSI Prestige 16 AI Evo B2HMG, Arc 140T
53.8 pt
Intel Core i9-13900HK
Beelink GTI13 Ultra, Iris Xe G7 96EUs
45.9 pt
Cinebench 2024 - CPU Multi Core
Intel Core Ultra 9 285K
Intel Core Ultra 9 285K, NVIDIA GeForce RTX 4090
2436 Points +18%
AMD Ryzen 9 9950X3D
AMD Ryzen 9 9950X3D, NVIDIA GeForce RTX 4090
2365 Points +15%
Intel Core Ultra 9 275HX
Asus Strix Scar 18 G835LX, GeForce RTX 5090 Laptop
2223 Points +8%
Apple M4 Max (16 cores)
Apple MacBook Pro 16 M4 Max, M4 Max 40-Core GPU
2069 Points +1%
Apple M4 Max (16 cores)
Apple MacBook Pro 16 M4 Max, M4 Max 40-Core GPU
2015 Points -2%
AMD Ryzen 9 9955HX
SCHENKER Neo 16 A25 5090 Engineering Sample, GeForce RTX 5090 Laptop
2058 Points
AMD Ryzen 9 7945HX
Minisforum BD795i SE, Radeon 610M
1799 Points -13%
AMD Ryzen 9 7945HX3D
Asus ROG Strix Scar 17 G733PYV-LL053X, NVIDIA GeForce RTX 4090 Laptop GPU
1772 Points -14%
Apple M4 Pro (14 cores)
Apple MacBook Pro 16 2024 M4 Pro, M4 Pro 20-Core GPU
1729 Points -16%
Intel Core i9-14900HX
MSI Raider 18 HX A14V, NVIDIA GeForce RTX 4080 Laptop GPU
1728 Points -16%
AMD Ryzen AI Max+ 395
Asus ROG Flow Z13 GZ302EA-RU073W, Radeon RX 8060S
1648 Points -20%
Apple M3 Max 16-Core
Apple MacBook Pro 14 2023 M3 Max, M3 Max 40-Core GPU
1532 Points -26%
Intel Core i7-14700HX
Lenovo ThinkPad P16 Gen 2, NVIDIA RTX 4000 Ada Generation Laptop GPU
1345 Points -35%
Intel Core Ultra 9 285H
MSI Prestige 16 AI Evo B2HMG, Arc 140T
991 Points -52%
Intel Core i9-13900HK
Beelink GTI13 Ultra, Iris Xe G7 96EUs
980 Points -52%
Geekbench 6.4 - Multi-Core
Apple M4 Max (16 cores)
Apple MacBook Pro 16 M4 Max, M4 Max 40-Core GPU
25760 Points +32%
Apple M4 Pro (14 cores)
Apple MacBook Pro 16 2024 M4 Pro, M4 Pro 20-Core GPU
22509 Points +15%
AMD Ryzen 9 9950X3D
AMD Ryzen 9 9950X3D, NVIDIA GeForce RTX 4090
22405 Points +15%
Intel Core Ultra 9 285K
Intel Core Ultra 9 285K, NVIDIA GeForce RTX 4090
21688 Points +11%
Intel Core Ultra 9 275HX
Asus Strix Scar 18 G835LX, GeForce RTX 5090 Laptop
21668 Points +11%
AMD Ryzen AI Max+ 395
Asus ROG Flow Z13 GZ302EA-RU073W, Radeon RX 8060S
21269 Points +9%
Apple M3 Max 16-Core
Apple MacBook Pro 14 2023 M3 Max, M3 Max 40-Core GPU
21264 Points +9%
AMD Ryzen 9 9955HX
SCHENKER Neo 16 A25 5090 Engineering Sample, GeForce RTX 5090 Laptop
19563 Points
Intel Core Ultra 9 285H
MSI Prestige 16 AI Evo B2HMG, Arc 140T
17262 Points -12%
AMD Ryzen 9 7945HX3D
Asus ROG Strix Scar 17 G733PYV-LL053X, NVIDIA GeForce RTX 4090 Laptop GPU
16957 Points -13%
AMD Ryzen 9 7945HX
Minisforum BD795i SE, Radeon 610M
16946 Points -13%
Intel Core i9-14900HX
MSI Raider 18 HX A14V, NVIDIA GeForce RTX 4080 Laptop GPU
16855 Points -14%
Intel Core i7-14700HX
Lenovo ThinkPad P16 Gen 2, NVIDIA RTX 4000 Ada Generation Laptop GPU
16326 Points -17%
Intel Core i9-13900HK
Beelink GTI13 Ultra, Iris Xe G7 96EUs
13309 Points -32%

Benchmarks do sistema

Nos benchmarks do sistema, como PCMark 10, CrossMark ou os testes 3DMark Physics, a CPU AMD quase sempre leva vantagem sobre o Core Ultra 9 275HX.

Entretanto, os outros componentes também influenciam naturalmente o desempenho geral do sistema.

PCMark 10 / Score
AMD Ryzen 9 9950X3D
AMD Ryzen 9 9950X3D, NVIDIA GeForce RTX 4090
10843 Points +15%
Intel Core Ultra 9 285K
Intel Core Ultra 9 285K, NVIDIA GeForce RTX 4090
10514 Points +12%
AMD Ryzen 9 9955HX
SCHENKER Neo 16 A25 5090 Engineering Sample, GeForce RTX 5090 Laptop
9402 Points
Intel Core i9-14900HX
MSI Raider 18 HX A14V, NVIDIA GeForce RTX 4080 Laptop GPU
9223 Points -2%
AMD Ryzen AI Max+ 395
Asus ROG Flow Z13 GZ302EA-RU073W, Radeon RX 8060S
9125 Points -3%
AMD Ryzen 9 7945HX3D
Asus ROG Strix Scar 17 G733PYV-LL053X, NVIDIA GeForce RTX 4090 Laptop GPU
9117 Points -3%
Intel Core Ultra 9 275HX
Asus Strix Scar 18 G835LX, GeForce RTX 5090 Laptop
8623 Points -8%
Intel Core i7-14700HX
Lenovo ThinkPad P16 Gen 2, NVIDIA RTX 4000 Ada Generation Laptop GPU
8353 Points -11%
Intel Core Ultra 9 285H
MSI Prestige 16 AI Evo B2HMG, Arc 140T
7838 Points -17%
Intel Core i9-13900HK
Beelink GTI13 Ultra, Iris Xe G7 96EUs
6791 Points -28%
AMD Ryzen 9 7945HX
Minisforum BD795i SE, Radeon 610M
6558 Points -30%
PCMark 10 / Essentials
AMD Ryzen 9 9950X3D
AMD Ryzen 9 9950X3D, NVIDIA GeForce RTX 4090
12435 Points +10%
AMD Ryzen AI Max+ 395
Asus ROG Flow Z13 GZ302EA-RU073W, Radeon RX 8060S
12005 Points +7%
Intel Core i9-13900HK
Beelink GTI13 Ultra, Iris Xe G7 96EUs
11963 Points +6%
Intel Core i9-14900HX
MSI Raider 18 HX A14V, NVIDIA GeForce RTX 4080 Laptop GPU
11825 Points +5%
Intel Core Ultra 9 285K
Intel Core Ultra 9 285K, NVIDIA GeForce RTX 4090
11613 Points +3%
AMD Ryzen 9 7945HX
Minisforum BD795i SE, Radeon 610M
11584 Points +3%
AMD Ryzen 9 7945HX3D
Asus ROG Strix Scar 17 G733PYV-LL053X, NVIDIA GeForce RTX 4090 Laptop GPU
11561 Points +3%
AMD Ryzen 9 9955HX
SCHENKER Neo 16 A25 5090 Engineering Sample, GeForce RTX 5090 Laptop
11271 Points
Intel Core Ultra 9 285H
MSI Prestige 16 AI Evo B2HMG, Arc 140T
11171 Points -1%
Intel Core i7-14700HX
Lenovo ThinkPad P16 Gen 2, NVIDIA RTX 4000 Ada Generation Laptop GPU
11157 Points -1%
Intel Core Ultra 9 275HX
Asus Strix Scar 18 G835LX, GeForce RTX 5090 Laptop
10966 Points -3%
PCMark 10 / Productivity
AMD Ryzen 9 9950X3D
AMD Ryzen 9 9950X3D, NVIDIA GeForce RTX 4090
12578 Points +19%
Intel Core Ultra 9 285K
Intel Core Ultra 9 285K, NVIDIA GeForce RTX 4090
12340 Points +16%
Intel Core i9-14900HX
MSI Raider 18 HX A14V, NVIDIA GeForce RTX 4080 Laptop GPU
11082 Points +5%
AMD Ryzen 9 7945HX3D
Asus ROG Strix Scar 17 G733PYV-LL053X, NVIDIA GeForce RTX 4090 Laptop GPU
10881 Points +3%
AMD Ryzen 9 9955HX
SCHENKER Neo 16 A25 5090 Engineering Sample, GeForce RTX 5090 Laptop
10601 Points
AMD Ryzen AI Max+ 395
Asus ROG Flow Z13 GZ302EA-RU073W, Radeon RX 8060S
10377 Points -2%
AMD Ryzen 9 7945HX
Minisforum BD795i SE, Radeon 610M
9965 Points -6%
Intel Core i7-14700HX
Lenovo ThinkPad P16 Gen 2, NVIDIA RTX 4000 Ada Generation Laptop GPU
9712 Points -8%
Intel Core Ultra 9 285H
MSI Prestige 16 AI Evo B2HMG, Arc 140T
9594 Points -9%
Intel Core Ultra 9 275HX
Asus Strix Scar 18 G835LX, GeForce RTX 5090 Laptop
9444 Points -11%
Intel Core i9-13900HK
Beelink GTI13 Ultra, Iris Xe G7 96EUs
8203 Points -23%
PCMark 10 / Digital Content Creation
AMD Ryzen 9 9950X3D
AMD Ryzen 9 9950X3D, NVIDIA GeForce RTX 4090
22121 Points +17%
Intel Core Ultra 9 285K
Intel Core Ultra 9 285K, NVIDIA GeForce RTX 4090
22005 Points +17%
AMD Ryzen 9 9955HX
SCHENKER Neo 16 A25 5090 Engineering Sample, GeForce RTX 5090 Laptop
18874 Points
Intel Core Ultra 9 275HX
Asus Strix Scar 18 G835LX, GeForce RTX 5090 Laptop
16802 Points -11%
AMD Ryzen AI Max+ 395
Asus ROG Flow Z13 GZ302EA-RU073W, Radeon RX 8060S
16551 Points -12%
AMD Ryzen 9 7945HX3D
Asus ROG Strix Scar 17 G733PYV-LL053X, NVIDIA GeForce RTX 4090 Laptop GPU
16348 Points -13%
Intel Core i9-14900HX
MSI Raider 18 HX A14V, NVIDIA GeForce RTX 4080 Laptop GPU
16246 Points -14%
Intel Core i7-14700HX
Lenovo ThinkPad P16 Gen 2, NVIDIA RTX 4000 Ada Generation Laptop GPU
14598 Points -23%
Intel Core Ultra 9 285H
MSI Prestige 16 AI Evo B2HMG, Arc 140T
12193 Points -35%
Intel Core i9-13900HK
Beelink GTI13 Ultra, Iris Xe G7 96EUs
8661 Points -54%
AMD Ryzen 9 7945HX
Minisforum BD795i SE, Radeon 610M
6630 Points -65%
CrossMark / Overall
Intel Core Ultra 9 285K
Intel Core Ultra 9 285K, NVIDIA GeForce RTX 4090
2529 Points +12%
AMD Ryzen 9 9950X3D
AMD Ryzen 9 9950X3D, NVIDIA GeForce RTX 4090
2380 Points +5%
AMD Ryzen AI Max+ 395
Asus ROG Flow Z13 GZ302EA-RU073W, Radeon RX 8060S
2274 Points +1%
AMD Ryzen 9 9955HX
SCHENKER Neo 16 A25 5090 Engineering Sample, GeForce RTX 5090 Laptop
2259 Points
Apple M4 Max (16 cores)
Apple MacBook Pro 16 M4 Max, M4 Max 40-Core GPU
2255 Points 0%
Intel Core Ultra 9 275HX
Asus Strix Scar 18 G835LX, GeForce RTX 5090 Laptop
2221 Points -2%
Intel Core Ultra 9 285H
MSI Prestige 16 AI Evo B2HMG, Arc 140T
2173 Points -4%
Intel Core i9-14900HX
MSI Raider 18 HX A14V, NVIDIA GeForce RTX 4080 Laptop GPU
2151 Points -5%
Apple M4 Pro (14 cores)
Apple MacBook Pro 16 2024 M4 Pro, M4 Pro 20-Core GPU
2148 Points -5%
AMD Ryzen 9 7945HX
Minisforum BD795i SE, Radeon 610M
2110 Points -7%
Intel Core i9-13900HK
Beelink GTI13 Ultra, Iris Xe G7 96EUs
2099 Points -7%
AMD Ryzen 9 7945HX3D
Asus ROG Strix Scar 17 G733PYV-LL053X, NVIDIA GeForce RTX 4090 Laptop GPU
2086 Points -8%
Apple M3 Max 16-Core
Apple MacBook Pro 14 2023 M3 Max, M3 Max 40-Core GPU
2032 Points -10%
Intel Core i7-14700HX
Lenovo ThinkPad P16 Gen 2, NVIDIA RTX 4000 Ada Generation Laptop GPU
2011 Points -11%
CrossMark / Productivity
Intel Core Ultra 9 285K
Intel Core Ultra 9 285K, NVIDIA GeForce RTX 4090
2369 Points +18%
AMD Ryzen 9 9950X3D
AMD Ryzen 9 9950X3D, NVIDIA GeForce RTX 4090
2085 Points +4%
Intel Core Ultra 9 285H
MSI Prestige 16 AI Evo B2HMG, Arc 140T
2050 Points +2%
Apple M4 Max (16 cores)
Apple MacBook Pro 16 M4 Max, M4 Max 40-Core GPU
2042 Points +1%
Intel Core Ultra 9 275HX
Asus Strix Scar 18 G835LX, GeForce RTX 5090 Laptop
2025 Points +1%
Intel Core i9-14900HX
MSI Raider 18 HX A14V, NVIDIA GeForce RTX 4080 Laptop GPU
2014 Points 0%
AMD Ryzen 9 9955HX
SCHENKER Neo 16 A25 5090 Engineering Sample, GeForce RTX 5090 Laptop
2014 Points
Intel Core i9-13900HK
Beelink GTI13 Ultra, Iris Xe G7 96EUs
2012 Points 0%
Apple M4 Pro (14 cores)
Apple MacBook Pro 16 2024 M4 Pro, M4 Pro 20-Core GPU
1980 Points -2%
AMD Ryzen 9 7945HX3D
Asus ROG Strix Scar 17 G733PYV-LL053X, NVIDIA GeForce RTX 4090 Laptop GPU
1948 Points -3%
AMD Ryzen 9 7945HX
Minisforum BD795i SE, Radeon 610M
1946 Points -3%
AMD Ryzen AI Max+ 395
Asus ROG Flow Z13 GZ302EA-RU073W, Radeon RX 8060S
1925 Points -4%
Intel Core i7-14700HX
Lenovo ThinkPad P16 Gen 2, NVIDIA RTX 4000 Ada Generation Laptop GPU
1862 Points -8%
Apple M3 Max 16-Core
Apple MacBook Pro 14 2023 M3 Max, M3 Max 40-Core GPU
1832 Points -9%
CrossMark / Creativity
AMD Ryzen 9 9950X3D
AMD Ryzen 9 9950X3D, NVIDIA GeForce RTX 4090
2987 Points +12%
AMD Ryzen AI Max+ 395
Asus ROG Flow Z13 GZ302EA-RU073W, Radeon RX 8060S
2949 Points +11%
Apple M4 Max (16 cores)
Apple MacBook Pro 16 M4 Max, M4 Max 40-Core GPU
2795 Points +5%
Intel Core Ultra 9 285K
Intel Core Ultra 9 285K, NVIDIA GeForce RTX 4090
2766 Points +4%
AMD Ryzen 9 9955HX
SCHENKER Neo 16 A25 5090 Engineering Sample, GeForce RTX 5090 Laptop
2661 Points
Intel Core Ultra 9 275HX
Asus Strix Scar 18 G835LX, GeForce RTX 5090 Laptop
2606 Points -2%
Apple M4 Pro (14 cores)
Apple MacBook Pro 16 2024 M4 Pro, M4 Pro 20-Core GPU
2590 Points -3%
Apple M3 Max 16-Core
Apple MacBook Pro 14 2023 M3 Max, M3 Max 40-Core GPU
2509 Points -6%
AMD Ryzen 9 7945HX3D
Asus ROG Strix Scar 17 G733PYV-LL053X, NVIDIA GeForce RTX 4090 Laptop GPU
2415 Points -9%
Intel Core i9-14900HX
MSI Raider 18 HX A14V, NVIDIA GeForce RTX 4080 Laptop GPU
2388 Points -10%
Intel Core Ultra 9 285H
MSI Prestige 16 AI Evo B2HMG, Arc 140T
2377 Points -11%
AMD Ryzen 9 7945HX
Minisforum BD795i SE, Radeon 610M
2363 Points -11%
Intel Core i7-14700HX
Lenovo ThinkPad P16 Gen 2, NVIDIA RTX 4000 Ada Generation Laptop GPU
2311 Points -13%
Intel Core i9-13900HK
Beelink GTI13 Ultra, Iris Xe G7 96EUs
2192 Points -18%
CrossMark / Responsiveness
Intel Core Ultra 9 285K
Intel Core Ultra 9 285K, NVIDIA GeForce RTX 4090
2351 Points +21%
Intel Core i9-13900HK
Beelink GTI13 Ultra, Iris Xe G7 96EUs
2097 Points +7%
Intel Core Ultra 9 285H
MSI Prestige 16 AI Evo B2HMG, Arc 140T
1981 Points +2%
AMD Ryzen 9 9955HX
SCHENKER Neo 16 A25 5090 Engineering Sample, GeForce RTX 5090 Laptop
1951 Points
AMD Ryzen 9 7945HX
Minisforum BD795i SE, Radeon 610M
1916 Points -2%
Intel Core i9-14900HX
MSI Raider 18 HX A14V, NVIDIA GeForce RTX 4080 Laptop GPU
1913 Points -2%
Intel Core Ultra 9 275HX
Asus Strix Scar 18 G835LX, GeForce RTX 5090 Laptop
1813 Points -7%
AMD Ryzen 9 9950X3D
AMD Ryzen 9 9950X3D, NVIDIA GeForce RTX 4090
1792 Points -8%
AMD Ryzen AI Max+ 395
Asus ROG Flow Z13 GZ302EA-RU073W, Radeon RX 8060S
1719 Points -12%
Intel Core i7-14700HX
Lenovo ThinkPad P16 Gen 2, NVIDIA RTX 4000 Ada Generation Laptop GPU
1666 Points -15%
AMD Ryzen 9 7945HX3D
Asus ROG Strix Scar 17 G733PYV-LL053X, NVIDIA GeForce RTX 4090 Laptop GPU
1649 Points -15%
Apple M4 Max (16 cores)
Apple MacBook Pro 16 M4 Max, M4 Max 40-Core GPU
1595 Points -18%
Apple M4 Pro (14 cores)
Apple MacBook Pro 16 2024 M4 Pro, M4 Pro 20-Core GPU
1566 Points -20%
Apple M3 Max 16-Core
Apple MacBook Pro 14 2023 M3 Max, M3 Max 40-Core GPU
1474 Points -24%
3DMark / Time Spy CPU
Intel Core Ultra 9 285K
Intel Core Ultra 9 285K, NVIDIA GeForce RTX 4090
18322 Points +39%
Intel Core i9-14900HX
MSI Raider 18 HX A14V, NVIDIA GeForce RTX 4080 Laptop GPU
17547 Points +33%
Intel Core Ultra 9 275HX
Asus Strix Scar 18 G835LX, GeForce RTX 5090 Laptop
17285 Points +31%
AMD Ryzen 9 9950X3D
AMD Ryzen 9 9950X3D, NVIDIA GeForce RTX 4090
16950 Points +29%
Intel Core i7-14700HX
Lenovo ThinkPad P16 Gen 2, NVIDIA RTX 4000 Ada Generation Laptop GPU
14526 Points +10%
AMD Ryzen 9 7945HX3D
Asus ROG Strix Scar 17 G733PYV-LL053X, NVIDIA GeForce RTX 4090 Laptop GPU
14131 Points +7%
AMD Ryzen 9 9955HX
SCHENKER Neo 16 A25 5090 Engineering Sample, GeForce RTX 5090 Laptop
13188 Points
Intel Core Ultra 9 285H
MSI Prestige 16 AI Evo B2HMG, Arc 140T
11650 Points -12%
Intel Core i9-13900HK
Beelink GTI13 Ultra, Iris Xe G7 96EUs
11314 Points -14%
AMD Ryzen AI Max+ 395
Asus ROG Flow Z13 GZ302EA-RU073W, Radeon RX 8060S
11285 Points -14%
3DMark / Fire Strike Physics
Intel Core Ultra 9 285K
Intel Core Ultra 9 285K, NVIDIA GeForce RTX 4090
53541 Points +25%
AMD Ryzen 9 9950X3D
AMD Ryzen 9 9950X3D, NVIDIA GeForce RTX 4090
49235 Points +15%
Intel Core Ultra 9 275HX
Asus Strix Scar 18 G835LX, GeForce RTX 5090 Laptop
48219 Points +12%
AMD Ryzen 9 9955HX
SCHENKER Neo 16 A25 5090 Engineering Sample, GeForce RTX 5090 Laptop
42890 Points
Intel Core i9-14900HX
MSI Raider 18 HX A14V, NVIDIA GeForce RTX 4080 Laptop GPU
41396 Points -3%
AMD Ryzen 9 7945HX3D
Asus ROG Strix Scar 17 G733PYV-LL053X, NVIDIA GeForce RTX 4090 Laptop GPU
38826 Points -9%
AMD Ryzen 9 7945HX
Minisforum BD795i SE, Radeon 610M
38792 Points -10%
AMD Ryzen AI Max+ 395
Asus ROG Flow Z13 GZ302EA-RU073W, Radeon RX 8060S
38075 Points -11%
Intel Core Ultra 9 285H
MSI Prestige 16 AI Evo B2HMG, Arc 140T
35044 Points -18%
Intel Core i7-14700HX
Lenovo ThinkPad P16 Gen 2, NVIDIA RTX 4000 Ada Generation Laptop GPU
30534 Points -29%
Intel Core i9-13900HK
Beelink GTI13 Ultra, Iris Xe G7 96EUs
26486 Points -38%

Desempenho em jogos

Agora chegamos ao desempenho em jogos. Pegamos uma série de títulos atuais e os testamos, embora não tenhamos usado tecnologias de upscaling em cada caso, pois queríamos ver a influência da CPU.

Deliberadamente, mantivemos o grupo de comparação pequeno aqui e comparamos apenas os dois objetos de teste atuais e o ROG Strix Scar 17que estava entre os laptops para jogos mais rápidos da última geração graças ao processador HX3D.

Em todos os testes, o AMD Ryzen 9 9955HX está à frente do Core Ultra 9 275HX e a vantagem média é de 5%. O antigo Strix Scar com o Ryzen 9 7945HX3D e a GPU para laptop RTX 4090 consegue se manter surpreendentemente bem e está até mesmo à frente em alguns títulos.

1080p Performance Rating - Percent
AMD Ryzen 9 9955HX
SCHENKER Neo 16 A25 5090 Engineering Sample, Nvidia GeForce RTX 5090 Laptop
99.7 pt
Intel Core Ultra 9 275HX
Asus Strix Scar 18 G835LX, Nvidia GeForce RTX 5090 Laptop
95.4 pt
AMD Ryzen 9 7945HX3D
Asus ROG Strix Scar 17 G733PYV-LL053X, NVIDIA GeForce RTX 4090 Laptop GPU
92.7 pt
Cyberpunk 2077 2.2 Phantom Liberty - 1920x1080 Ultra Preset (FSR off)
AMD Ryzen 9 7945HX3D
Asus ROG Strix Scar 17 G733PYV-LL053X, NVIDIA GeForce RTX 4090 Laptop GPU
158 (123.9min - 206max) fps +1%
AMD Ryzen 9 9955HX
SCHENKER Neo 16 A25 5090 Engineering Sample, Nvidia GeForce RTX 5090 Laptop
157 (116.5min - 208max) fps
Intel Core Ultra 9 275HX
Asus Strix Scar 18 G835LX, Nvidia GeForce RTX 5090 Laptop
154.9 (126.3min - 196max) fps -1%
F1 24 - 1920x1080 Ultra High Preset AA:T AF:16x
AMD Ryzen 9 9955HX
SCHENKER Neo 16 A25 5090 Engineering Sample, Nvidia GeForce RTX 5090 Laptop
158.3 (73min, 93P1 - 189max) fps
Intel Core Ultra 9 275HX
Asus Strix Scar 18 G835LX, Nvidia GeForce RTX 5090 Laptop
148 fps -7%
AMD Ryzen 9 7945HX3D
Asus ROG Strix Scar 17 G733PYV-LL053X, NVIDIA GeForce RTX 4090 Laptop GPU
144.9 (85min, 92P1 - 172max) fps -8%
Assassin's Creed Shadows - 1920x1080 Ultra High
AMD Ryzen 9 9955HX
SCHENKER Neo 16 A25 5090 Engineering Sample, Nvidia GeForce RTX 5090 Laptop
74 fps
Intel Core Ultra 9 275HX
Asus Strix Scar 18 G835LX, Nvidia GeForce RTX 5090 Laptop
65 fps -12%
AMD Ryzen 9 7945HX3D
Asus ROG Strix Scar 17 G733PYV-LL053X, NVIDIA GeForce RTX 4090 Laptop GPU
55 fps -26%
Call of Duty Black Ops 6 - 1920x1080 Extreme Preset
AMD Ryzen 9 7945HX3D
Asus ROG Strix Scar 17 G733PYV-LL053X, NVIDIA GeForce RTX 4090 Laptop GPU
150 fps +2%
AMD Ryzen 9 9955HX
SCHENKER Neo 16 A25 5090 Engineering Sample, Nvidia GeForce RTX 5090 Laptop
147 fps
Intel Core Ultra 9 275HX
Asus Strix Scar 18 G835LX, Nvidia GeForce RTX 5090 Laptop
147 fps 0%
Monster Hunter Wilds - 1920x1080 ultra, RT: high, no upscaling
AMD Ryzen 9 9955HX
SCHENKER Neo 16 A25 5090 Engineering Sample, Nvidia GeForce RTX 5090 Laptop
89 fps
Intel Core Ultra 9 275HX
Asus Strix Scar 18 G835LX, Nvidia GeForce RTX 5090 Laptop
87.6 fps -2%
AMD Ryzen 9 7945HX3D
Asus ROG Strix Scar 17 G733PYV-LL053X, NVIDIA GeForce RTX 4090 Laptop GPU
85.6 fps -4%
Indiana Jones and the Great Circle - 1920x1080 Very Ultra Preset
AMD Ryzen 9 9955HX
SCHENKER Neo 16 A25 5090 Engineering Sample, Nvidia GeForce RTX 5090 Laptop
130.6 fps
AMD Ryzen 9 7945HX3D
Asus ROG Strix Scar 17 G733PYV-LL053X, NVIDIA GeForce RTX 4090 Laptop GPU
128.4 fps -2%
Intel Core Ultra 9 275HX
Asus Strix Scar 18 G835LX, Nvidia GeForce RTX 5090 Laptop
127.9 fps -2%
Baldur's Gate 3 - 1920x1080 Ultra Preset
AMD Ryzen 9 9955HX
SCHENKER Neo 16 A25 5090 Engineering Sample, Nvidia GeForce RTX 5090 Laptop
202 fps
Intel Core Ultra 9 275HX
Asus Strix Scar 18 G835LX, Nvidia GeForce RTX 5090 Laptop
193.7 fps -4%
AMD Ryzen 9 7945HX3D
Asus ROG Strix Scar 17 G733PYV-LL053X, NVIDIA GeForce RTX 4090 Laptop GPU
178.8 fps -11%
Alan Wake 2 - 1920x1080 High Preset
AMD Ryzen 9 9955HX
SCHENKER Neo 16 A25 5090 Engineering Sample, Nvidia GeForce RTX 5090 Laptop
124.7 fps
Intel Core Ultra 9 275HX
Asus Strix Scar 18 G835LX, Nvidia GeForce RTX 5090 Laptop
116.4 fps -7%
AMD Ryzen 9 7945HX3D
Asus ROG Strix Scar 17 G733PYV-LL053X, NVIDIA GeForce RTX 4090 Laptop GPU
116.1 fps -7%

Na resolução QHD, o Ryzen 9 9955HX continua à frente do Core Ultra 9 275HX em todos os jogos, com a diferença novamente em torno de 5%. O antigo Strix Scar 17 continua a se manter, mas tem que ceder um pouco mais de terreno para o novo Scar 18 2025.

QHD Performance Rating - Percent
AMD Ryzen 9 9955HX
SCHENKER Neo 16 A25 5090 Engineering Sample, Nvidia GeForce RTX 5090 Laptop
100 pt
Intel Core Ultra 9 275HX
Asus Strix Scar 18 G835LX, Nvidia GeForce RTX 5090 Laptop
94.5 pt
AMD Ryzen 9 7945HX3D
Asus ROG Strix Scar 17 G733PYV-LL053X, NVIDIA GeForce RTX 4090 Laptop GPU
91 pt
Cyberpunk 2077 2.2 Phantom Liberty - 2560x1440 Ultra Preset (FSR off)
AMD Ryzen 9 9955HX
SCHENKER Neo 16 A25 5090 Engineering Sample, Nvidia GeForce RTX 5090 Laptop
110.6 (91.2min - 141.1max) fps
Intel Core Ultra 9 275HX
Asus Strix Scar 18 G835LX, Nvidia GeForce RTX 5090 Laptop
106.8 (87.4min - 135.4max) fps -3%
AMD Ryzen 9 7945HX3D
Asus ROG Strix Scar 17 G733PYV-LL053X, NVIDIA GeForce RTX 4090 Laptop GPU
99.5 (80.5min - 128.2max) fps -10%
F1 24 - 2560x1440 Ultra High Preset AA:T AF:16x
AMD Ryzen 9 9955HX
SCHENKER Neo 16 A25 5090 Engineering Sample, Nvidia GeForce RTX 5090 Laptop
105.5 (73min, 83P1 - 126max) fps
Intel Core Ultra 9 275HX
Asus Strix Scar 18 G835LX, Nvidia GeForce RTX 5090 Laptop
100 fps -5%
AMD Ryzen 9 7945HX3D
Asus ROG Strix Scar 17 G733PYV-LL053X, NVIDIA GeForce RTX 4090 Laptop GPU
96.8 (79min, 78P1 - 118max) fps -8%
Assassin's Creed Shadows - 2560x1440 Ultra High
AMD Ryzen 9 9955HX
SCHENKER Neo 16 A25 5090 Engineering Sample, Nvidia GeForce RTX 5090 Laptop
59 fps
Intel Core Ultra 9 275HX
Asus Strix Scar 18 G835LX, Nvidia GeForce RTX 5090 Laptop
51 fps -14%
AMD Ryzen 9 7945HX3D
Asus ROG Strix Scar 17 G733PYV-LL053X, NVIDIA GeForce RTX 4090 Laptop GPU
47 fps -20%
Call of Duty Black Ops 6 - 2560x1440 Extreme Preset
AMD Ryzen 9 9955HX
SCHENKER Neo 16 A25 5090 Engineering Sample, Nvidia GeForce RTX 5090 Laptop
123 fps
AMD Ryzen 9 7945HX3D
Asus ROG Strix Scar 17 G733PYV-LL053X, NVIDIA GeForce RTX 4090 Laptop GPU
119 fps -3%
Intel Core Ultra 9 275HX
Asus Strix Scar 18 G835LX, Nvidia GeForce RTX 5090 Laptop
117 fps -5%
Monster Hunter Wilds - 2560x1440 ultra, RT: high, no upscaling
AMD Ryzen 9 9955HX
SCHENKER Neo 16 A25 5090 Engineering Sample, Nvidia GeForce RTX 5090 Laptop
75 fps
Intel Core Ultra 9 275HX
Asus Strix Scar 18 G835LX, Nvidia GeForce RTX 5090 Laptop
72 fps -4%
AMD Ryzen 9 7945HX3D
Asus ROG Strix Scar 17 G733PYV-LL053X, NVIDIA GeForce RTX 4090 Laptop GPU
69.4 fps -7%
Indiana Jones and the Great Circle - 2560x1440 Very Ultra Preset
AMD Ryzen 9 9955HX
SCHENKER Neo 16 A25 5090 Engineering Sample, Nvidia GeForce RTX 5090 Laptop
105 fps
Intel Core Ultra 9 275HX
Asus Strix Scar 18 G835LX, Nvidia GeForce RTX 5090 Laptop
102.2 fps -3%
AMD Ryzen 9 7945HX3D
Asus ROG Strix Scar 17 G733PYV-LL053X, NVIDIA GeForce RTX 4090 Laptop GPU
100.5 fps -4%
Baldur's Gate 3 - 2560x1440 Ultra Preset
AMD Ryzen 9 9955HX
SCHENKER Neo 16 A25 5090 Engineering Sample, Nvidia GeForce RTX 5090 Laptop
150.5 fps
Intel Core Ultra 9 275HX
Asus Strix Scar 18 G835LX, Nvidia GeForce RTX 5090 Laptop
145.6 fps -3%
AMD Ryzen 9 7945HX3D
Asus ROG Strix Scar 17 G733PYV-LL053X, NVIDIA GeForce RTX 4090 Laptop GPU
133.3 fps -11%
Alan Wake 2 - 2560x1440 High Preset
AMD Ryzen 9 9955HX
SCHENKER Neo 16 A25 5090 Engineering Sample, Nvidia GeForce RTX 5090 Laptop
88.3 fps
Intel Core Ultra 9 275HX
Asus Strix Scar 18 G835LX, Nvidia GeForce RTX 5090 Laptop
82.4 fps -7%
AMD Ryzen 9 7945HX3D
Asus ROG Strix Scar 17 G733PYV-LL053X, NVIDIA GeForce RTX 4090 Laptop GPU
82 fps -7%

Na resolução 4K, a influência do processador diminui ainda mais e a diferença entre os chips da AMD e da Intel se torna menor, embora a AMD consiga pequenas vantagens em todos os jogos.

O Strix Scar 17 agora fica para trás mais claramente aqui, mas isso se deve à GPU mais antiga do laptop RTX 4090.

4K Performance Rating - Percent
AMD Ryzen 9 9955HX
SCHENKER Neo 16 A25 5090 Engineering Sample, Nvidia GeForce RTX 5090 Laptop
100 pt
Intel Core Ultra 9 275HX
Asus Strix Scar 18 G835LX, Nvidia GeForce RTX 5090 Laptop
96.3 pt
AMD Ryzen 9 7945HX3D
Asus ROG Strix Scar 17 G733PYV-LL053X, NVIDIA GeForce RTX 4090 Laptop GPU
88.9 pt
F1 24 - 3840x2160 Ultra High Preset AA:T AF:16x
AMD Ryzen 9 9955HX
SCHENKER Neo 16 A25 5090 Engineering Sample, Nvidia GeForce RTX 5090 Laptop
54.2 (45min, 45P1 - 65max) fps
Intel Core Ultra 9 275HX
Asus Strix Scar 18 G835LX, Nvidia GeForce RTX 5090 Laptop
52 fps -4%
AMD Ryzen 9 7945HX3D
Asus ROG Strix Scar 17 G733PYV-LL053X, NVIDIA GeForce RTX 4090 Laptop GPU
48.4 (41min, 40P1 - 59max) fps -11%
Assassin's Creed Shadows - 3840x2160 Ultra High
AMD Ryzen 9 9955HX
SCHENKER Neo 16 A25 5090 Engineering Sample, Nvidia GeForce RTX 5090 Laptop
39 fps
Intel Core Ultra 9 275HX
Asus Strix Scar 18 G835LX, Nvidia GeForce RTX 5090 Laptop
36 fps -8%
AMD Ryzen 9 7945HX3D
Asus ROG Strix Scar 17 G733PYV-LL053X, NVIDIA GeForce RTX 4090 Laptop GPU
34 fps -13%
Call of Duty Black Ops 6 - 3840x2160 Extreme Preset
AMD Ryzen 9 9955HX
SCHENKER Neo 16 A25 5090 Engineering Sample, Nvidia GeForce RTX 5090 Laptop
82 fps
Intel Core Ultra 9 275HX
Asus Strix Scar 18 G835LX, Nvidia GeForce RTX 5090 Laptop
79 fps -4%
AMD Ryzen 9 7945HX3D
Asus ROG Strix Scar 17 G733PYV-LL053X, NVIDIA GeForce RTX 4090 Laptop GPU
76 fps -7%
Monster Hunter Wilds - 3840x2160 ultra, RT: high, no upscaling
AMD Ryzen 9 9955HX
SCHENKER Neo 16 A25 5090 Engineering Sample, Nvidia GeForce RTX 5090 Laptop
48.5 fps
Intel Core Ultra 9 275HX
Asus Strix Scar 18 G835LX, Nvidia GeForce RTX 5090 Laptop
46.3 fps -5%
AMD Ryzen 9 7945HX3D
Asus ROG Strix Scar 17 G733PYV-LL053X, NVIDIA GeForce RTX 4090 Laptop GPU
42.8 fps -12%
Indiana Jones and the Great Circle - 3840x2160 Very Ultra Preset
AMD Ryzen 9 9955HX
SCHENKER Neo 16 A25 5090 Engineering Sample, Nvidia GeForce RTX 5090 Laptop
66.6 fps
Intel Core Ultra 9 275HX
Asus Strix Scar 18 G835LX, Nvidia GeForce RTX 5090 Laptop
65 fps -2%
AMD Ryzen 9 7945HX3D
Asus ROG Strix Scar 17 G733PYV-LL053X, NVIDIA GeForce RTX 4090 Laptop GPU
60.6 fps -9%
Baldur's Gate 3 - 3840x2160 Ultra Preset
AMD Ryzen 9 9955HX
SCHENKER Neo 16 A25 5090 Engineering Sample, Nvidia GeForce RTX 5090 Laptop
84.3 fps
Intel Core Ultra 9 275HX
Asus Strix Scar 18 G835LX, Nvidia GeForce RTX 5090 Laptop
82.8 fps -2%
AMD Ryzen 9 7945HX3D
Asus ROG Strix Scar 17 G733PYV-LL053X, NVIDIA GeForce RTX 4090 Laptop GPU
74.6 fps -12%
Alan Wake 2 - 3840x2160 High Preset
AMD Ryzen 9 9955HX
SCHENKER Neo 16 A25 5090 Engineering Sample, Nvidia GeForce RTX 5090 Laptop
47.7 fps
Intel Core Ultra 9 275HX
Asus Strix Scar 18 G835LX, Nvidia GeForce RTX 5090 Laptop
46 fps -4%
AMD Ryzen 9 7945HX3D
Asus ROG Strix Scar 17 G733PYV-LL053X, NVIDIA GeForce RTX 4090 Laptop GPU
43.4 fps -9%
Cyberpunk 2077 2.2 Phantom Liberty - 3840x2160 Ultra Preset (FSR off)
AMD Ryzen 9 9955HX
SCHENKER Neo 16 A25 5090 Engineering Sample, Nvidia GeForce RTX 5090 Laptop
52.9 (42.8min - 66.9max) fps
Intel Core Ultra 9 275HX
Asus Strix Scar 18 G835LX, Nvidia GeForce RTX 5090 Laptop
52.1 (43.9min - 64.8max) fps -2%
AMD Ryzen 9 7945HX3D
Asus ROG Strix Scar 17 G733PYV-LL053X, NVIDIA GeForce RTX 4090 Laptop GPU
44.2 (37min - 55max) fps -16%

Desempenho com diferentes limites de potência

Também testamos o desempenho dos dois novos processadores em limites fixos de energia. Aqui o senhor pode ver que o Core Ultra 9 275HX oferece um bom desempenho mesmo com valores de TDP mais baixos e pode superar o Ryzen 9 9955HX, mas apenas no Cinebench 2024.

No antigo Cinebench R23, a AMD está à frente até 100 W, mas depois fica para trás de forma bastante significativa.

Cinebench 2024 Multi
TDP AMD Ryzen 9 9955HX Core Ultra 9 275HX Core i9-14900HX
150 watts 2.061 pontos 2.158 pontos 1.834 pontos
130 watts 2.030 pontos 2.095 pontos 1.757 pontos
115 watts 2.008 pontos 2.015 pontos 1.525 pontos
100 watts 1.948 pontos 1.963 pontos 1.424 pontos
80 watts 1.809 pontos 1.875 pontos 1.373 pontos
55 Watt 1.489 pontos 1.633 pontos 1.105 pontos
Cinebench R23 Multi
TDP AMD Ryzen 9 9955HX Core Ultra 9 275HX Ryzen 9 7945HX3D Ryzen 9 7945HX Core i9-14900HX
150 watts 39.537 pontos 38.108 pontos 30.308 pontos
130 watts 38,502 pontos 36,165 pontos 34,202 pontos 28,933
115 watts 37,157 pontos 34,760 pontos 33,361 pontos 27,750
100 watts 35,500 pontos 33,670 pontos 32,977 pontos 32,947 pontos 26,232 pontos
80 watts 31,641 pontos 31,880 pontos 30,804 pontos 30,907 pontos 23,334 pontos
55 watts 23,849 pontos 27,283 pontos 26,045 pontos 18,258 pontos

Conclusão: A AMD tem a CPU para jogos mais rápida para laptops enquanto aguarda a chegada do Ryzen 9 9955HX3D

Os dois novos processadores móveis de última geração da AMD e da Intel não oferecem surpresas e são mais rápidos do que seus respectivos antecessores nos testes de núcleo único e de vários núcleos. A Intel também tem uma pequena vantagem nos testes sintéticos do Cinebench, mas não consegue reproduzir isso no Geekbench ou nos benchmarks do sistema.

Nos jogos, o vencedor é bastante evidente, pois com a GPU idêntica para laptop Nvidia GeForce RTX 5090 (análise detalhada aqui), o processador AMD é ligeiramente mais rápido em todos os jogos que testamos.

Isso aumenta a preferência pelo iminente Ryzen 9 9955HX3D, que mais uma vez deve oferecer um desempenho significativamente melhor em jogos. No entanto, não esperamos ver dispositivos de teste com o chip HX3D por algumas semanas, e só podemos esperar que a disponibilidade do processador HX3D seja melhor nesta geração.

Please share our article, every link counts!
Mail Logo
> Análises e revisões de portáteis e celulares > Análises > Análises > Análise do AMD Ryzen 9 9955HX vs. Intel Core Ultra 9 275HX: A batalha pela CPU mais rápida para jogos
Andreas Osthoff, 2025-04- 7 (Update: 2025-04- 7)