Notebookcheck Logo
Teaser

Análise: A CPU para desktop Ryzen 5 9600X da AMD faz com que as CPUs Raptor Lake da Intel pareçam antigas graças à eficiente arquitetura Zen 5

CPU hexa-core econômica.

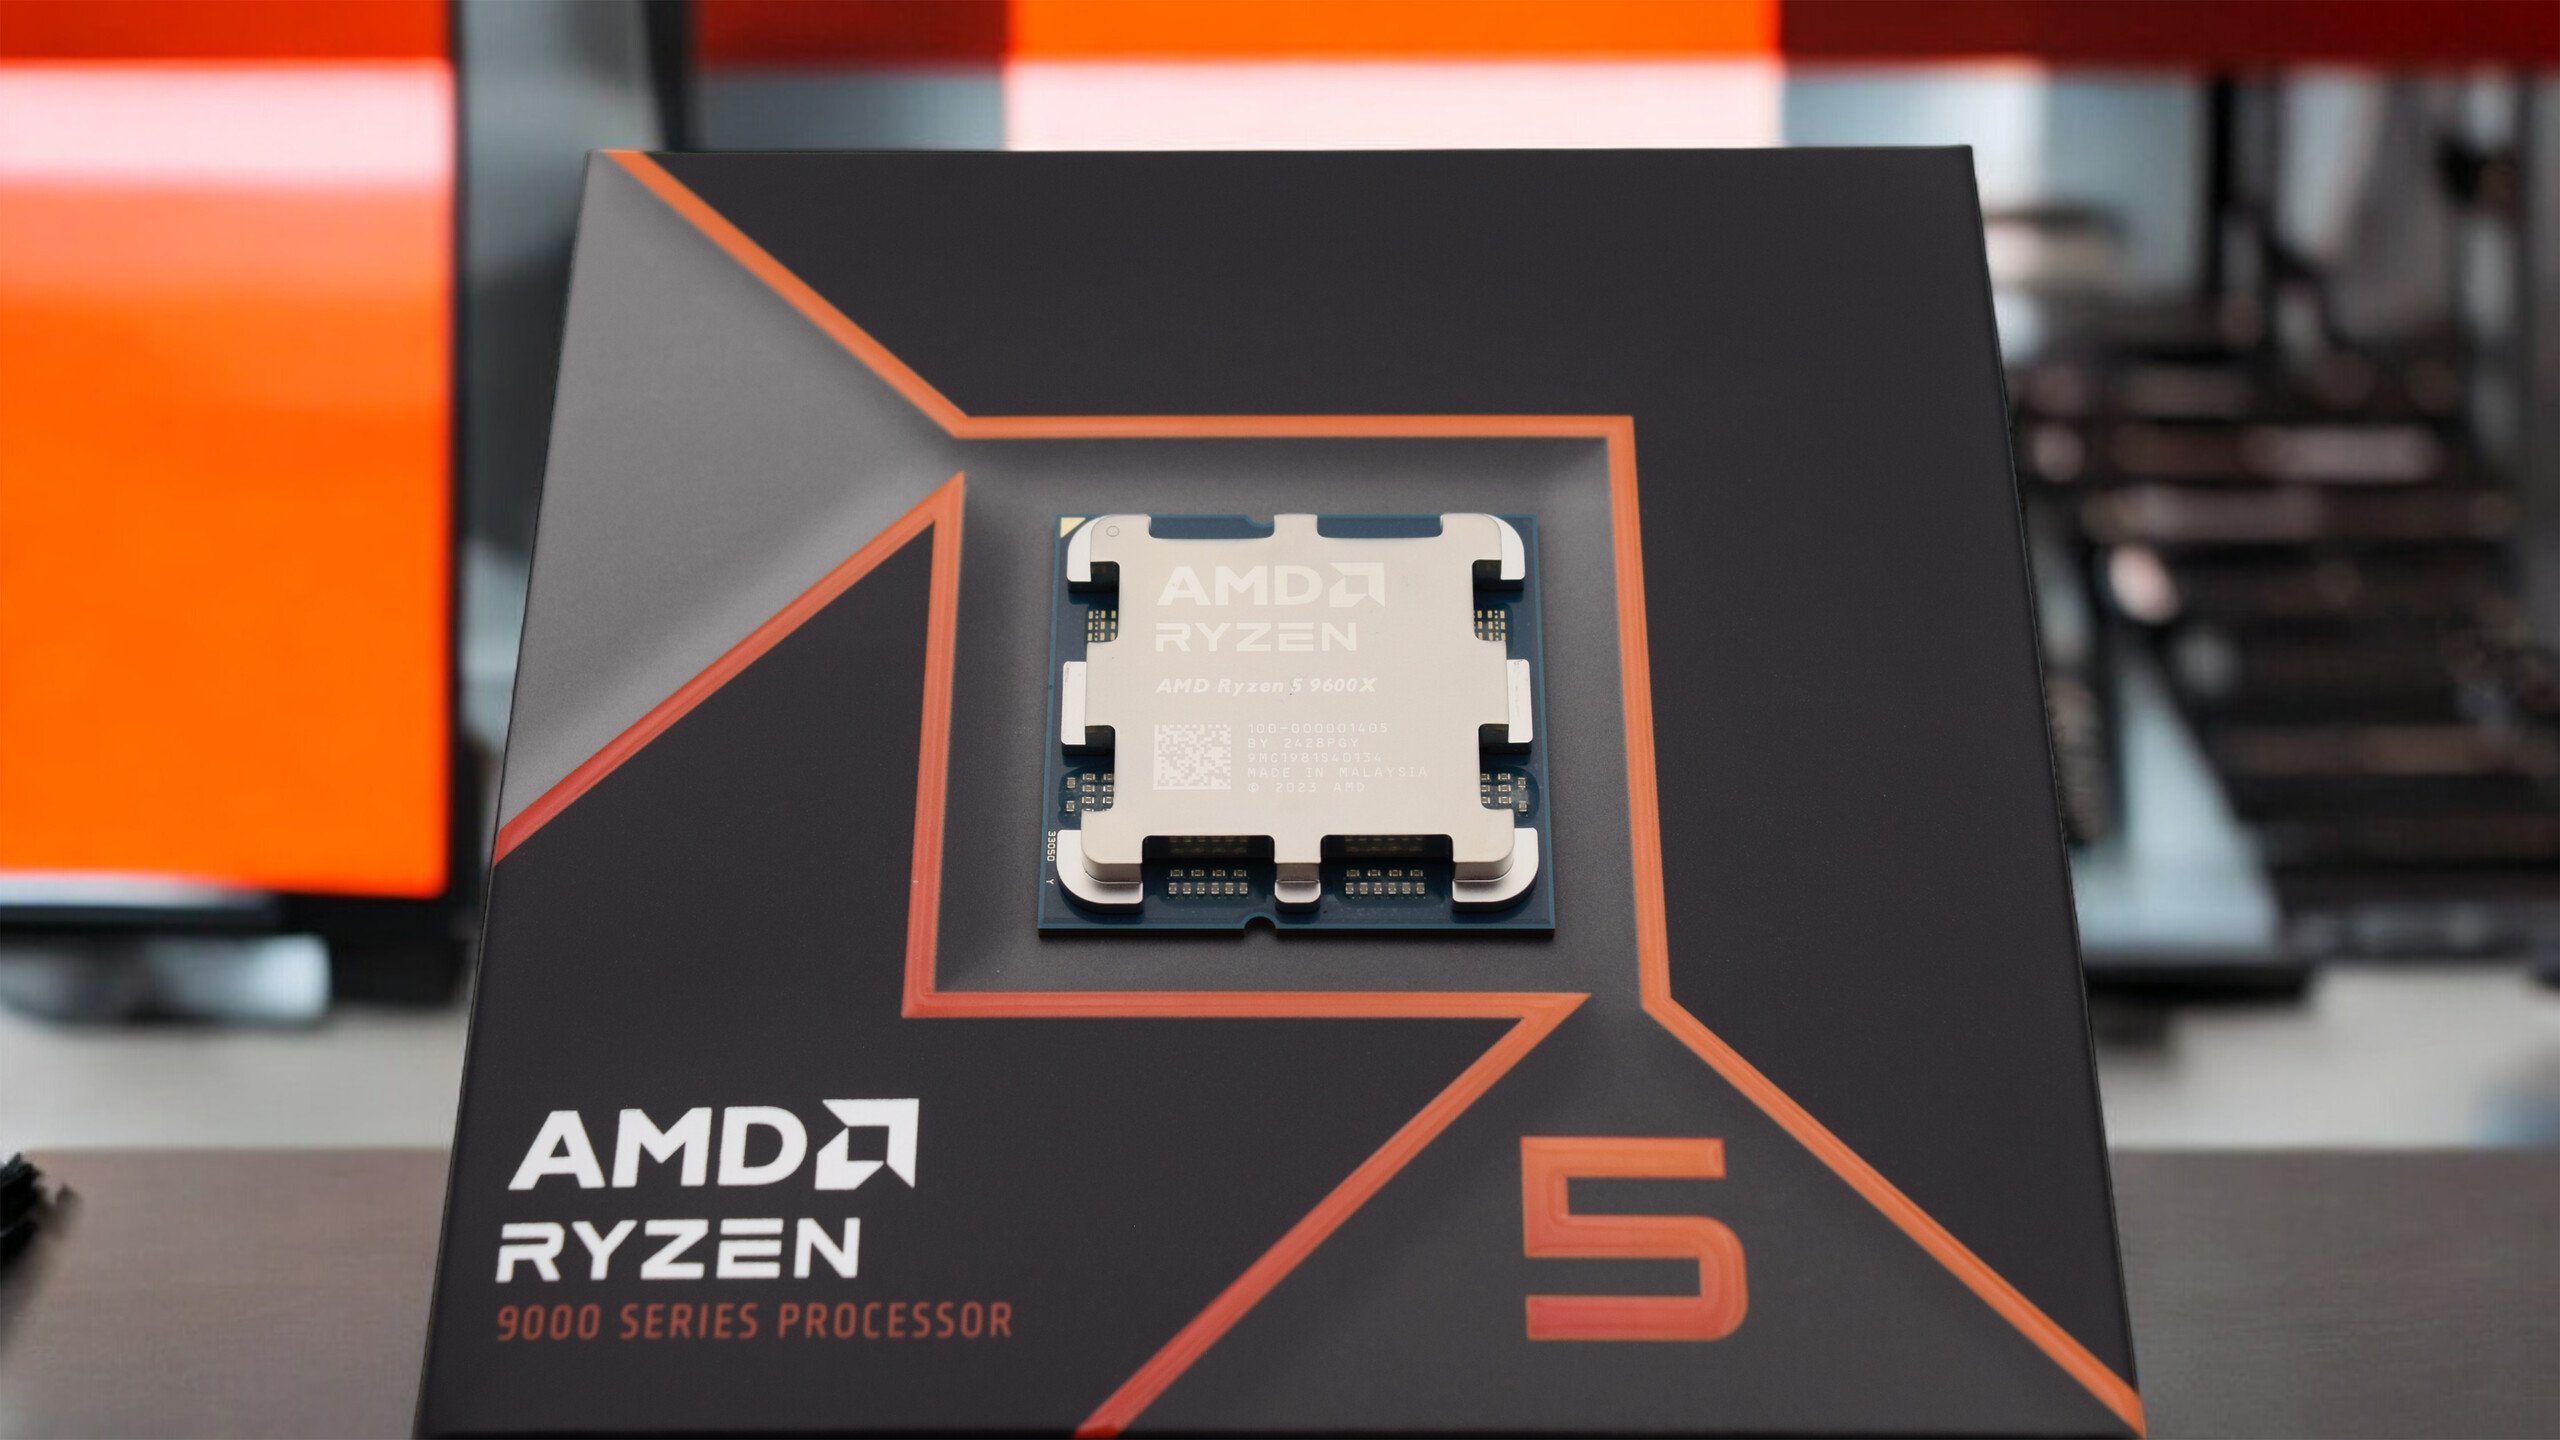
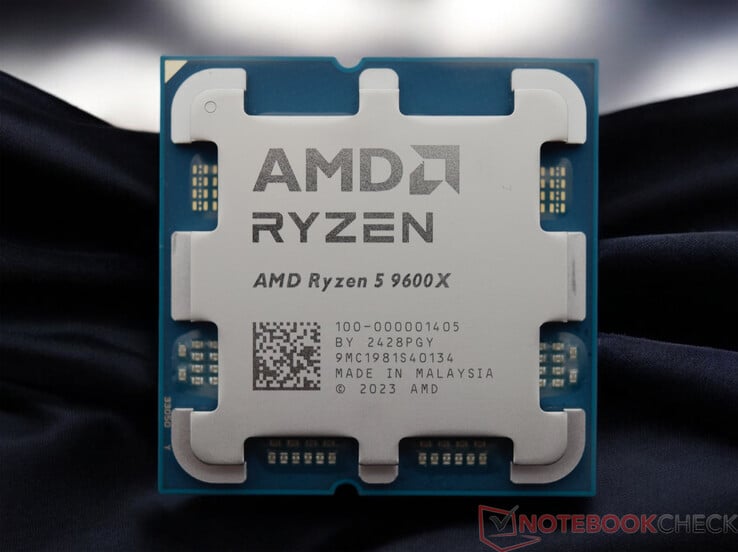
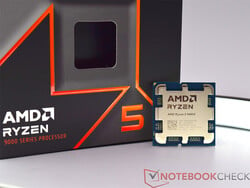
O AMD Ryzen 5 9600X é o processador de 6 núcleos mais rápido da AMD e é baseado na novíssima arquitetura Zen 5. Graças à eficiência extremamente aprimorada, espera-se que os novos processadores da série Ryzen-9000 estabeleçam novos padrões e superem os já supereficientes processadores Ryzen 7000. Nesta análise, analisamos mais de perto seu desempenho em comparação com a concorrência interna e com os concorrentes da Intel.
Sebastian Bade (traduzido por DeepL / Ninh Duy) Publicado 🇺🇸 🇩🇪 ...
AMD Ryzen (Zen) Zen 5 Desktop Gaming

A AMD agora está oferecendo quatro novos processadores baseados no soquete AM5 que apresentam uma arquitetura revisada chamada Zen 5. O AMD Ryzen 7 9700X e o AMD Ryzen 5 9600X serão os primeiros a chegar ao mercado. Os dois modelos topo de linha virão uma semana depois, completando a nova linha.

Se o senhor der uma olhada apenas nos dados técnicos, não notará nenhuma mudança significativa à primeira vista. O número de núcleos e threads permaneceu inalterado em comparação com o Ryzen 7000. As maiores mudanças podem ser vistas em seu consumo de energia, que a AMD reduziu drasticamente dentro das CPUs Ryzen 9000. Como resultado, a AMD melhorou ainda mais a eficiência de seus processadores Zen 5. O TDP do AMD Ryzen 5 9600X, que analisamos em detalhes nesta análise, foi reduzido de 105 watts para 65 watts. Seu PPT (Package Power Tracking) cai de 142 para apenas 88 watts sob carga. No entanto, seu desempenho deve mostrar alguma melhora em relação ao AMD Ryzen 5 7600X. Como um efeito colateral positivo, o AMD Ryzen 5 9600X é significativamente mais fácil de resfriar do que um AMD Ryzen 5 7600X, que facilmente ultrapassou a marca de 90°C em alguns casos. A AMD está mudando para o processo de 4 nm da TSMC para produção. O AMD Ryzen 5 9600X também é equipado com uma unidade gráfica integrada. No entanto, ela tem apenas 2 CUs e, portanto, é adequada apenas para aplicativos 2D simples.

Se o senhor pretende comprar um AMD Ryzen 9000, poderá usar as placas-mãe existentes. Após uma atualização do BIOS, as placas-mãe AM5 atuais também podem ser equipadas com os processadores mais recentes. Para obter mais detalhes, consulte as respectivas páginas de suporte dos fabricantes de placas-mãe. Novas placas-mãe ainda não estão disponíveis. Além disso, a faixa de overclocking da RAM DDR5 (DDR5-8.000 MT/s) deve ser significativamente aprimorada nas placas-mãe AMD série 870. A AMD também menciona a longevidade do soquete, que agora é especificado como 2027+. Essa medida é muito bem-vinda, e a AMD já demonstrou com o AM4 que ele pode ser usado por várias gerações. A AMD está muito à frente da Intel nesse aspecto.

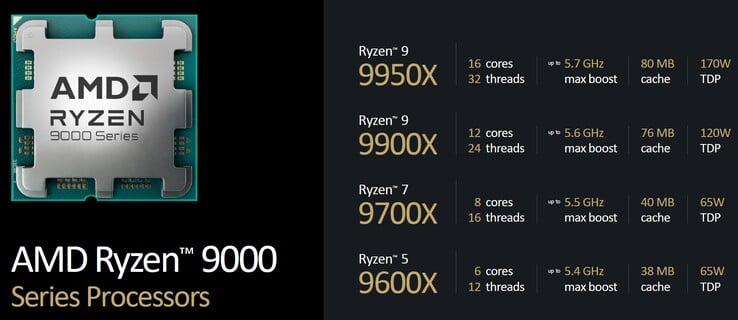
Visão geral dos processadores AMD Ryzen 9000 (fonte: AMD)
AMD Ryzen 5 9600X
Processador
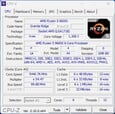
AMD Ryzen 5 9600X 6 x 3.9 - 5.4 GHz, 88 W PL2 / Short Burst, 65 W PL1 / Sustained, Granite Ridge
Placa gráfica
NVIDIA GeForce RTX 4090 - 24 GB VRAM, Análises do: 2610 MHz, Memoría: 1313 MHz, 450 W TDP, GDDR6X, 560.70
Memória
32 GB 
, DDR5-6000 (EXPO), CL30-38-38-96
placa mãe
AMD X670E
Sistema Operativo
Microsoft Windows 11 Pro
Características adicionais
36 Meses Garantia
Preço
309 EUR
Nota: O fabricante pode utilizar componentes de diferentes fornecedores, incluindo painéis de exibição, unidades ou cartões de memória com especificações semelhantes.


Usamos o seguinte sistema para nossos benchmarks e testes:

  • Mesa de teste aberta Streacom BC1 V2
  • AMD Ryzen 5 9600X
  • Gigabyte X670E Aorus Master, BIOS: F21
  • Resfriamento a água Custom Loop (bomba: Watercool WCP D5, radiador: EK MO-RA3 420 Pro)
  • Palit GeForce RTX 4090 GameRock OC
  • EVGA SuperNOVA P+ 1600W
  • G.Skill Trident Z5 Neo DDR5-6000 2x 16 GB, EXPO (DDR5-6000 CL30-38-38-96)
  • Solidigm SSD D7-P4511 1 TB, M.2 22110 (SO + benchmarks)
  • Intel SSD DC P4618 - 6,4 TB (jogos)
  • Microsoft Windows 11 Professional 64-bit (versão 23H2)

Visão geral do AMD Ryzen 9000 e do AMD Ryzen 7000

Modelo Cores/threads Base clock Turbo clock Cache L2 Cache L3 TDP PPT Preço de lançamento
Ryzen 9 9950X 16/32 4,3 GHz 5,7 GHz 16x 1 MB 64 MB 170 W 200 W TBD
Ryzen 9 7950X 16/32 4.5 GHz 5.7 GHz 16x 1 MB 64 MB 170 W 230 W 699 USD / 849 EUR
Ryzen 9 9900X 12/24 4,4 GHz 5,6 GHz 12x 1 MB 64 MB 120 W 162 W TBD
Ryzen 9 7900X 12/24 4,7 GHz 5,6 GHz 12x 1 MB 64 MB 170 W 230 W 549 USD / 669 EUR
Ryzen 7 9700X 8/16 3.8 GHz 5.5 GHz 8x 1 MB 32 MB 65 W 88 W 359 USD / 399 EUR
Ryzen 7 7700X 8/16 4,5 GHz 5,4 GHz 8x 1 MB 32 MB 105 W 142 W 399 USD / 479 EUR
Ryzen 5 9600X 6/12 3,9 GHz 5,4 GHz 6x1 MB 32 MB 65W 88 W 279 USD / 309 EUR
Ryzen 5 7600X 6/12 4,7 GHz 5,3 GHz 6x 1 MB 32 MB 105 W 142 W 299 USD / 359 EUR

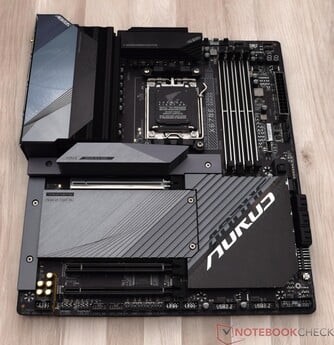
Gigabyte X670E Aorus Master como base e mais informações sobre o sistema de teste

Como as placas-mãe atuais também são compatíveis com os novos processadores AMD Ryzen 9000, não é absolutamente necessário mudar para uma nova placa-mãe AM5 com um chipset 800. Também deve ser mencionado neste ponto que as novas placas-mãe estão chegando há muito tempo. De qualquer forma, não há nenhuma vantagem significativa sobre as placas-mãe já disponíveis com um chipset 600. Quem já possui uma placa-mãe com um chipset B650E ou X670X certamente está bem equipado. Até mesmo as futuras placas de vídeo com uma interface PCIe 5.0 podem ser conectadas com toda a sua largura de banda.

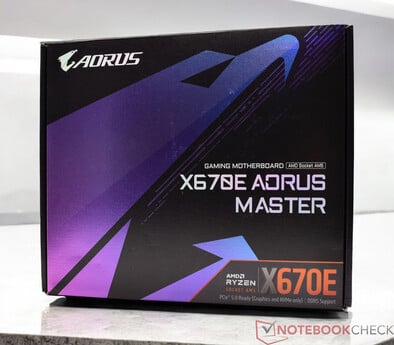
Para o nosso teste do AMD Ryzen 5 9600X, usamos o Gigabyte X670E Aorus Master, que já usamos em nosso teste do AMD Ryzen 9 7900X e do AMD Ryzen 7 7600X. O BIOS que usamos (F21) e os drivers foram fornecidos antecipadamente pela AMD. Seguimos as especificações da AMD para a RAM. Aqui, também, usamos a mesma RAM que em nossos testes dos dois modelos Ryzen 7000 mencionados.

Gigabyte X670E Aorus Master

Condições de teste

Realizamos todos os testes de desempenho usando o perfil de energia de desempenho máximo. Só fizemos desvios desse perfil durante as medições de consumo de energia. Usamos um sistema de resfriamento de água em loop personalizado como unidade de resfriamento do sistema. Devido ao seu excelente desempenho de resfriamento, o processador conseguiu aproveitar todo o seu potencial. Mais detalhes podem ser encontrados na visão geral do sistema de teste acima. Para cumprir as condições de garantia do fabricante, a AMD listou várias unidades de resfriamento em seu site que são compatíveis com os processadores.

Benchmarks de processador

Considerando que é um processador "pequeno" de 6 núcleos, o AMD Ryzen 5 9600X teve um desempenho surpreendentemente bom em nossos testes de desempenho da CPU. Em sua classificação geral, o AMD Ryzen 5 9600X ficou entre um AMD Ryzen 9 5950X e um AMD Ryzen 7 7800X3D. Isso mostra que o componente de 6 núcleos pode certamente competir com os modelos maiores. Em uma comparação direta com o AMD Ryzen 5 7600Xobservamos apenas um pequeno aumento de desempenho de quatro pontos percentuais. No entanto, é preciso observar que o modelo mais antigo tem muito mais margem de manobra em termos de consumo de energia. Com isso em mente, a vantagem de desempenho do novo AMD Ryzen 5 9600X é considerável.

Ao analisar mais de perto o duelo com a Intel, o senhor pode ver que o AMD Ryzen 5 9600X ficou atrás do Intel Core i5-13600K. Apenas três pontos percentuais separaram os dois na comparação de desempenho médio. Um Intel Core i5-14600K também estava ao alcance, com apenas seis por cento de diferença entre eles. No entanto, se analisarmos os resultados de benchmark em detalhes, nosso processador de 6 núcleos teve uma clara desvantagem nos benchmarks multi-thread. Nesse caso, o AMD Ryzen 5 9600X estava em pé de igualdade com o Intel Core i5-12600K. Um quadro completamente diferente surgiu quando se tratou de seu desempenho de núcleo único, em que obtivemos melhores valores com nossa amostra de teste do que um Intel Core i9-14900K.

O senhor pode encontrar mais benchmarks para os processadores que testamos aqui.

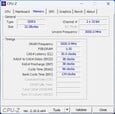
CPU-Z
CPU-Z
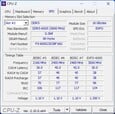
CPU-Z
CPU-Z
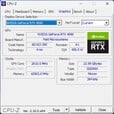
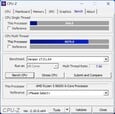
CPU-Z
CPU-Z
Performance Rating - Percent
Intel Core i9-14900K
i9-14900K, 3200 MHz
81.5 pt
Intel Core i9-13900K
i9-13900K, 3000 MHz
79.2 pt
AMD Ryzen 9 7950X
R9 7950X, 4500 MHz
77.3 pt
AMD Ryzen 9 7950X3D
R9 7950X3D, 4200 MHz
76.1 pt
AMD Ryzen 9 7900X
R9 7900X, 4700 MHz
71 pt
Intel Core i5-14600K
i5-14600K, 3500 MHz
68.2 pt
Intel Core i9-12900K
i9-12900K, 3200 MHz
67.5 pt
AMD Ryzen 9 5950X
R9 5950X, 3400 MHz
66.2 pt
Intel Core i5-13600K
i5-13600K, 3500 MHz
66.1 pt
AMD Ryzen 5 9600X
Ryzen 5 9600X, 3900 MHz
63.8 pt
AMD Ryzen 7 7800X3D
R7 7800X3D, 4200 MHz
63.2 pt
AMD Ryzen 5 7600X
R5 7600X, 4700 MHz
61 pt
Intel Core i5-12600K
i5-12600K, 2800 MHz
59.1 pt
Intel Core i5-13400
i5-13400, 2500 MHz
56.5 pt
Intel Core i5-12400F
i5-12400F, 2500 MHz
51.9 pt
Cinebench R23
Single Core
Intel Core i9-14900K
i9-14900K, 3200 MHz
2351 Points +8%
Intel Core i9-13900K
i9-13900K, 3000 MHz
2267 Points +4%
AMD Ryzen 5 9600X
Ryzen 5 9600X, 3900 MHz
2180 Points
Intel Core i5-14600K
i5-14600K, 3500 MHz
2064 Points -5%
AMD Ryzen 9 7950X3D
R9 7950X3D, 4200 MHz
2053 Points -6%
AMD Ryzen 9 7950X
R9 7950X, 4500 MHz
2045 Points -6%
AMD Ryzen 9 7900X
R9 7900X, 4700 MHz
2039 Points -6%
Intel Core i5-13600K
i5-13600K, 3500 MHz
2010 Points -8%
Intel Core i9-12900K
i9-12900K, 3200 MHz
1998 Points -8%
AMD Ryzen 5 7600X
R5 7600X, 4700 MHz
1967 Points -10%
Intel Core i5-12600K
i5-12600K, 2800 MHz
1907 Points -13%
AMD Ryzen 7 7800X3D
R7 7800X3D, 4200 MHz
1820 Points -17%
Intel Core i5-13400
i5-13400, 2500 MHz
1786 Points -18%
Intel Core i5-12400F
i5-12400F, 2500 MHz
1680 Points -23%
AMD Ryzen 9 5950X
R9 5950X, 3400 MHz
1649 Points -24%
Multi Core
Intel Core i9-14900K
i9-14900K, 3200 MHz
41193 Points +140%
Intel Core i9-13900K
i9-13900K, 3000 MHz
40103 Points +133%
AMD Ryzen 9 7950X
R9 7950X, 4500 MHz
37792 Points +120%
AMD Ryzen 9 7950X3D
R9 7950X3D, 4200 MHz
36291 Points +111%
AMD Ryzen 9 7900X
R9 7900X, 4700 MHz
29480 Points +72%
AMD Ryzen 9 5950X
R9 5950X, 3400 MHz
27062 Points +58%
Intel Core i9-12900K
i9-12900K, 3200 MHz
27005 Points +57%
Intel Core i5-14600K
i5-14600K, 3500 MHz
24491 Points +43%
Intel Core i5-13600K
i5-13600K, 3500 MHz
24268 Points +41%
AMD Ryzen 7 7800X3D
R7 7800X3D, 4200 MHz
18086 Points +5%
Intel Core i5-12600K
i5-12600K, 2800 MHz
17491 Points +2%
AMD Ryzen 5 9600X
Ryzen 5 9600X, 3900 MHz
17176 Points
Intel Core i5-13400
i5-13400, 2500 MHz
15953 Points -7%
AMD Ryzen 5 7600X
R5 7600X, 4700 MHz
15322 Points -11%
Intel Core i5-12400F
i5-12400F, 2500 MHz
12380 Points -28%
Cinebench R20
CPU (Single Core)
Intel Core i9-14900K
i9-14900K, 3200 MHz
900 Points +5%
AMD Ryzen 5 9600X
Ryzen 5 9600X, 3900 MHz
858 Points
Intel Core i9-13900K
i9-13900K, 3000 MHz
828 Points -3%
AMD Ryzen 9 7950X
R9 7950X, 4500 MHz
795 Points -7%
AMD Ryzen 9 7950X3D
R9 7950X3D, 4200 MHz
795 Points -7%
Intel Core i5-14600K
i5-14600K, 3500 MHz
790 Points -8%
AMD Ryzen 9 7900X
R9 7900X, 4700 MHz
786 Points -8%
Intel Core i5-13600K
i5-13600K, 3500 MHz
775 Points -10%
Intel Core i9-12900K
i9-12900K, 3200 MHz
766 Points -11%
AMD Ryzen 5 7600X
R5 7600X, 4700 MHz
761 Points -11%
Intel Core i5-12600K
i5-12600K, 2800 MHz
734 Points -14%
AMD Ryzen 7 7800X3D
R7 7800X3D, 4200 MHz
709 Points -17%
Intel Core i5-13400
i5-13400, 2500 MHz
688 Points -20%
Intel Core i5-12400F
i5-12400F, 2500 MHz
653 Points -24%
AMD Ryzen 9 5950X
R9 5950X, 3400 MHz
641 Points -25%
CPU (Multi Core)
Intel Core i9-14900K
i9-14900K, 3200 MHz
15466 Points +130%
Intel Core i9-13900K
i9-13900K, 3000 MHz
15181 Points +126%
AMD Ryzen 9 7950X
R9 7950X, 4500 MHz
14786 Points +120%
AMD Ryzen 9 7950X3D
R9 7950X3D, 4200 MHz
14188 Points +111%
AMD Ryzen 9 7900X
R9 7900X, 4700 MHz
11563 Points +72%
AMD Ryzen 9 5950X
R9 5950X, 3400 MHz
10482 Points +56%
Intel Core i9-12900K
i9-12900K, 3200 MHz
10240 Points +52%
Intel Core i5-14600K
i5-14600K, 3500 MHz
9371 Points +39%
Intel Core i5-13600K
i5-13600K, 3500 MHz
9265 Points +38%
AMD Ryzen 7 7800X3D
R7 7800X3D, 4200 MHz
7121 Points +6%
AMD Ryzen 5 9600X
Ryzen 5 9600X, 3900 MHz
6719 Points
Intel Core i5-12600K
i5-12600K, 2800 MHz
6692 Points 0%
Intel Core i5-13400
i5-13400, 2500 MHz
6135 Points -9%
AMD Ryzen 5 7600X
R5 7600X, 4700 MHz
5985 Points -11%
Intel Core i5-12400F
i5-12400F, 2500 MHz
4740 Points -29%
Cinebench R15
CPU Single 64Bit
AMD Ryzen 5 9600X
Ryzen 5 9600X, 3900 MHz
341 Points
Intel Core i9-14900K
i9-14900K, 3200 MHz
332 Points -3%
AMD Ryzen 9 7950X
R9 7950X, 4500 MHz
328 Points -4%
Intel Core i9-13900K
i9-13900K, 3000 MHz
327 Points -4%
AMD Ryzen 9 7950X3D
R9 7950X3D, 4200 MHz
326 Points -4%
AMD Ryzen 9 7900X
R9 7900X, 4700 MHz
324 Points -5%
AMD Ryzen 5 7600X
R5 7600X, 4700 MHz
315 Points -8%
Intel Core i5-14600K
i5-14600K, 3500 MHz
297 Points -13%
AMD Ryzen 7 7800X3D
R7 7800X3D, 4200 MHz
291 Points -15%
Intel Core i5-13600K
i5-13600K, 3500 MHz
289 Points -15%
Intel Core i9-12900K
i9-12900K, 3200 MHz
286 Points -16%
Intel Core i5-12600K
i5-12600K, 2800 MHz
275 Points -19%
AMD Ryzen 9 5950X
R9 5950X, 3400 MHz
272 Points -20%
Intel Core i5-13400
i5-13400, 2500 MHz
257 Points -25%
Intel Core i5-12400F
i5-12400F, 2500 MHz
244 Points -28%
CPU Multi 64Bit
Intel Core i9-14900K
i9-14900K, 3200 MHz
6282 Points +139%
AMD Ryzen 9 7950X
R9 7950X, 4500 MHz
6209 Points +136%
Intel Core i9-13900K
i9-13900K, 3000 MHz
6191 Points +135%
AMD Ryzen 9 7950X3D
R9 7950X3D, 4200 MHz
5974 Points +127%
AMD Ryzen 9 7900X
R9 7900X, 4700 MHz
4856 Points +85%
AMD Ryzen 9 5950X
R9 5950X, 3400 MHz
4492 Points +71%
Intel Core i9-12900K
i9-12900K, 3200 MHz
4057 Points +54%
Intel Core i5-13600K
i5-13600K, 3500 MHz
3643 Points +39%
Intel Core i5-14600K
i5-14600K, 3500 MHz
3640 Points +38%
AMD Ryzen 7 7800X3D
R7 7800X3D, 4200 MHz
2974 Points +13%
AMD Ryzen 5 9600X
Ryzen 5 9600X, 3900 MHz
2630 Points
Intel Core i5-12600K
i5-12600K, 2800 MHz
2555 Points -3%
AMD Ryzen 5 7600X
R5 7600X, 4700 MHz
2507 Points -5%
Intel Core i5-13400
i5-13400, 2500 MHz
2358 Points -10%
Intel Core i5-12400F
i5-12400F, 2500 MHz
1759 Points -33%
Cinebench R11.5
CPU Single 64Bit
Intel Core i9-14900K
i9-14900K, 3200 MHz
4.02 Points +1%
AMD Ryzen 5 9600X
Ryzen 5 9600X, 3900 MHz
4 Points
Intel Core i9-13900K
i9-13900K, 3000 MHz
3.92 Points -2%
AMD Ryzen 9 7950X
R9 7950X, 4500 MHz
3.86 Points -3%
AMD Ryzen 9 7950X3D
R9 7950X3D, 4200 MHz
3.86 Points -3%
AMD Ryzen 9 7900X
R9 7900X, 4700 MHz
3.83 Points -4%
AMD Ryzen 5 7600X
R5 7600X, 4700 MHz
3.72 Points -7%
Intel Core i5-14600K
i5-14600K, 3500 MHz
3.58 Points -10%
Intel Core i9-12900K
i9-12900K, 3200 MHz
3.49 Points -13%
Intel Core i5-13600K
i5-13600K, 3500 MHz
3.48 Points -13%
AMD Ryzen 7 7800X3D
R7 7800X3D, 4200 MHz
3.43 Points -14%
Intel Core i5-12600K
i5-12600K, 2800 MHz
3.31 Points -17%
AMD Ryzen 9 5950X
R9 5950X, 3400 MHz
3.14 Points -21%
Intel Core i5-13400
i5-13400, 2500 MHz
3.1 Points -22%
Intel Core i5-12400F
i5-12400F, 2500 MHz
2.95 Points -26%
CPU Multi 64Bit
Intel Core i9-14900K
i9-14900K, 3200 MHz
72.24 Points +134%
Intel Core i9-13900K
i9-13900K, 3000 MHz
70.78 Points +129%
AMD Ryzen 9 7950X
R9 7950X, 4500 MHz
68.61 Points +122%
AMD Ryzen 9 7950X3D
R9 7950X3D, 4200 MHz
64.59 Points +109%
AMD Ryzen 9 7900X
R9 7900X, 4700 MHz
54.51 Points +77%
AMD Ryzen 9 5950X
R9 5950X, 3400 MHz
49.6 Points +61%
Intel Core i9-12900K
i9-12900K, 3200 MHz
47.06 Points +52%
Intel Core i5-13600K
i5-13600K, 3500 MHz
42.38 Points +37%
Intel Core i5-14600K
i5-14600K, 3500 MHz
40.96 Points +33%
AMD Ryzen 7 7800X3D
R7 7800X3D, 4200 MHz
33.48 Points +8%
AMD Ryzen 5 9600X
Ryzen 5 9600X, 3900 MHz
30.86 Points
Intel Core i5-12600K
i5-12600K, 2800 MHz
30.01 Points -3%
AMD Ryzen 5 7600X
R5 7600X, 4700 MHz
28.41 Points -8%
Intel Core i5-13400
i5-13400, 2500 MHz
27.36 Points -11%
Intel Core i5-12400F
i5-12400F, 2500 MHz
20.39 Points -34%
Cinebench R10
Rendering Single CPUs 64Bit
Intel Core i9-14900K
i9-14900K, 3200 MHz
18511 Points +6%
Intel Core i9-13900K
i9-13900K, 3000 MHz
18236 Points +4%
AMD Ryzen 5 9600X
Ryzen 5 9600X, 3900 MHz
17541 Points
Intel Core i5-14600K
i5-14600K, 3500 MHz
16643 Points -5%
AMD Ryzen 9 7900X
R9 7900X, 4700 MHz
16338 Points -7%
AMD Ryzen 9 7950X
R9 7950X, 4500 MHz
16260 Points -7%
Intel Core i5-13600K
i5-13600K, 3500 MHz
16235 Points -7%
Intel Core i9-12900K
i9-12900K, 3200 MHz
16144 Points -8%
AMD Ryzen 5 7600X
R5 7600X, 4700 MHz
16010 Points -9%
Intel Core i5-12600K
i5-12600K, 2800 MHz
15180 Points -13%
AMD Ryzen 7 7800X3D
R7 7800X3D, 4200 MHz
14485 Points -17%
Intel Core i5-13400
i5-13400, 2500 MHz
14142 Points -19%
Intel Core i5-12400F
i5-12400F, 2500 MHz
13664 Points -22%
AMD Ryzen 9 5950X
R9 5950X, 3400 MHz
13279 Points -24%
AMD Ryzen 9 7950X3D
R9 7950X3D, 4200 MHz
8853 Points -50%
Rendering Multiple CPUs 64Bit
Intel Core i9-14900K
i9-14900K, 3200 MHz
144156 Points +44%
Intel Core i9-13900K
i9-13900K, 3000 MHz
132000 Points +32%
AMD Ryzen 9 7950X
R9 7950X, 4500 MHz
130289 Points +30%
AMD Ryzen 9 7900X
R9 7900X, 4700 MHz
121250 Points +21%
Intel Core i5-14600K
i5-14600K, 3500 MHz
115171 Points +15%
Intel Core i9-12900K
i9-12900K, 3200 MHz
112749 Points +12%
Intel Core i5-13600K
i5-13600K, 3500 MHz
110412 Points +10%
AMD Ryzen 9 5950X
R9 5950X, 3400 MHz
104638 Points +4%
AMD Ryzen 5 9600X
Ryzen 5 9600X, 3900 MHz
100227 Points
AMD Ryzen 7 7800X3D
R7 7800X3D, 4200 MHz
94035 Points -6%
AMD Ryzen 5 7600X
R5 7600X, 4700 MHz
89641 Points -11%
Intel Core i5-12600K
i5-12600K, 2800 MHz
89478 Points -11%
Intel Core i5-13400
i5-13400, 2500 MHz
83214 Points -17%
AMD Ryzen 9 7950X3D
R9 7950X3D, 4200 MHz
72361 Points -28%
Intel Core i5-12400F
i5-12400F, 2500 MHz
69819 Points -30%
Blender - v2.79 BMW27 CPU
Intel Core i5-12400F
i5-12400F, 2500 MHz
269 Seconds * -46%
Intel Core i5-13400
i5-13400, 2500 MHz
206 Seconds * -12%
AMD Ryzen 5 7600X
R5 7600X, 4700 MHz
203 Seconds * -10%
Intel Core i5-12600K
i5-12600K, 2800 MHz
189.5 Seconds * -3%
AMD Ryzen 5 9600X
Ryzen 5 9600X, 3900 MHz
184 Seconds *
AMD Ryzen 7 7800X3D
R7 7800X3D, 4200 MHz
169 Seconds * +8%
Intel Core i5-13600K
i5-13600K, 3500 MHz
135 Seconds * +27%
Intel Core i5-14600K
i5-14600K, 3500 MHz
134 Seconds * +27%
Intel Core i9-12900K
i9-12900K, 3200 MHz
121.1 Seconds * +34%
AMD Ryzen 9 5950X
R9 5950X, 3400 MHz
112.8 Seconds * +39%
AMD Ryzen 9 7900X
R9 7900X, 4700 MHz
106 Seconds * +42%
AMD Ryzen 9 7950X3D
R9 7950X3D, 4200 MHz
86 Seconds * +53%
AMD Ryzen 9 7950X
R9 7950X, 4500 MHz
85 Seconds * +54%
Intel Core i9-13900K
i9-13900K, 3000 MHz
80 Seconds * +57%
Intel Core i9-14900K
i9-14900K, 3200 MHz
80 Seconds * +57%
wPrime 2.10
32m
Intel Core i9-12900K
i9-12900K, 3200 MHz
4.924 s * -88%
Intel Core i5-12600K
i5-12600K, 2800 MHz
4.725 s * -81%
Intel Core i5-12400F
i5-12400F, 2500 MHz
4.078 s * -56%
Intel Core i5-13400
i5-13400, 2500 MHz
3.474 s * -33%
AMD Ryzen 5 7600X
R5 7600X, 4700 MHz
2.78 s * -6%
AMD Ryzen 5 9600X
Ryzen 5 9600X, 3900 MHz
2.617 s *
AMD Ryzen 9 5950X
R9 5950X, 3400 MHz
2.538 s * +3%
Intel Core i5-13600K
i5-13600K, 3500 MHz
2.527 s * +3%
AMD Ryzen 7 7800X3D
R7 7800X3D, 4200 MHz
2.435 s * +7%
Intel Core i5-14600K
i5-14600K, 3500 MHz
2.39 s * +9%
Intel Core i9-14900K
i9-14900K, 3200 MHz
2.07 s * +21%
AMD Ryzen 9 7950X3D
R9 7950X3D, 4200 MHz
2.007 s * +23%
Intel Core i9-13900K
i9-13900K, 3000 MHz
1.818 s * +31%
AMD Ryzen 9 7900X
R9 7900X, 4700 MHz
1.781 s * +32%
AMD Ryzen 9 7950X
R9 7950X, 4500 MHz
1.669 s * +36%
1024m
Intel Core i5-13400
i5-13400, 2500 MHz
452.309 s * -523%
Intel Core i5-12600K
i5-12600K, 2800 MHz
202.7 s * -179%
Intel Core i9-12900K
i9-12900K, 3200 MHz
190.6 s * -163%
Intel Core i5-13600K
i5-13600K, 3500 MHz
177.592 s * -145%
Intel Core i5-14600K
i5-14600K, 3500 MHz
158.77 s * -119%
Intel Core i5-12400F
i5-12400F, 2500 MHz
112.849 s * -56%
Intel Core i9-13900K
i9-13900K, 3000 MHz
79.738 s * -10%
AMD Ryzen 5 7600X
R5 7600X, 4700 MHz
74.491 s * -3%
Intel Core i9-14900K
i9-14900K, 3200 MHz
74.47 s * -3%
AMD Ryzen 5 9600X
Ryzen 5 9600X, 3900 MHz
72.546 s *
AMD Ryzen 9 5950X
R9 5950X, 3400 MHz
64.9 s * +11%
AMD Ryzen 7 7800X3D
R7 7800X3D, 4200 MHz
62.733 s * +14%
AMD Ryzen 9 7900X
R9 7900X, 4700 MHz
39.954 s * +45%
AMD Ryzen 9 7950X3D
R9 7950X3D, 4200 MHz
33.879 s * +53%
AMD Ryzen 9 7950X
R9 7950X, 4500 MHz
30.811 s * +58%
X264 HD Benchmark 4.0
Pass 1
Intel Core i9-14900K
i9-14900K, 3200 MHz
433.5 (424min - 434max) fps +19%
Intel Core i9-13900K
i9-13900K, 3000 MHz
412 (410min - 417max) fps +13%
Intel Core i5-14600K
i5-14600K, 3500 MHz
411 (410min - 412max) fps +13%
AMD Ryzen 9 7950X3D
R9 7950X3D, 4200 MHz
392.5 (391min - 397max) fps +8%
Intel Core i5-13600K
i5-13600K, 3500 MHz
388 (386min - 388max) fps +7%
AMD Ryzen 9 7950X
R9 7950X, 4500 MHz
379.5 (378min - 385max) fps +4%
AMD Ryzen 9 7900X
R9 7900X, 4700 MHz
376 (369min - 378max) fps +3%
Intel Core i9-12900K
i9-12900K, 3200 MHz
368.5 (366min - 369max) fps +1%
AMD Ryzen 5 7600X
R5 7600X, 4700 MHz
367 (363min - 371max) fps +1%
AMD Ryzen 5 9600X
Ryzen 5 9600X, 3900 MHz
364 (361min - 367max) fps
AMD Ryzen 7 7800X3D
R7 7800X3D, 4200 MHz
344 (339min - 346max) fps -5%
AMD Ryzen 9 5950X
R9 5950X, 3400 MHz
338.5 (337min - 340max) fps -7%
Intel Core i5-12600K
i5-12600K, 2800 MHz
333.5 (332min - 336max) fps -8%
Intel Core i5-13400
i5-13400, 2500 MHz
311 (310min - 312max) fps -15%
Intel Core i5-12400F
i5-12400F, 2500 MHz
252.5 (249min - 256max) fps -31%
Pass 2
Intel Core i9-14900K
i9-14900K, 3200 MHz
286.5 (285min - 287max) fps +86%
Intel Core i9-13900K
i9-13900K, 3000 MHz
267 (266min - 271max) fps +73%
AMD Ryzen 9 7950X
R9 7950X, 4500 MHz
266.5 (263min - 267max) fps +73%
AMD Ryzen 9 7950X3D
R9 7950X3D, 4200 MHz
265.5 (263min - 266max) fps +72%
AMD Ryzen 9 7900X
R9 7900X, 4700 MHz
241 (240min - 242max) fps +56%
AMD Ryzen 9 5950X
R9 5950X, 3400 MHz
221 (220min - 221max) fps +44%
Intel Core i5-14600K
i5-14600K, 3500 MHz
209 (208min - 209max) fps +36%
Intel Core i9-12900K
i9-12900K, 3200 MHz
206 (206min - 206max) fps +34%
Intel Core i5-13600K
i5-13600K, 3500 MHz
199 (198.5min - 199.4max) fps +29%
AMD Ryzen 7 7800X3D
R7 7800X3D, 4200 MHz
169.25 (169.1min - 170max) fps +10%
AMD Ryzen 5 9600X
Ryzen 5 9600X, 3900 MHz
154 (153.4min - 154.3max) fps
Intel Core i5-12600K
i5-12600K, 2800 MHz
148 (147min - 148max) fps -4%
AMD Ryzen 5 7600X
R5 7600X, 4700 MHz
147.8 (147.7min - 147.9max) fps -4%
Intel Core i5-13400
i5-13400, 2500 MHz
135.8 (135.7min - 135.9max) fps -12%
Intel Core i5-12400F
i5-12400F, 2500 MHz
101.35 (101.1min - 101.5max) fps -34%
WinRAR - Result
AMD Ryzen 9 7900X
R9 7900X, 4700 MHz
17225 KB/s +16%
AMD Ryzen 7 7800X3D
R7 7800X3D, 4200 MHz
16585 KB/s +12%
AMD Ryzen 9 7950X
R9 7950X, 4500 MHz
16351 KB/s +10%
AMD Ryzen 5 7600X
R5 7600X, 4700 MHz
16178 KB/s +9%
Intel Core i9-14900K
i9-14900K, 3200 MHz
16108 KB/s +9%
AMD Ryzen 9 7950X3D
R9 7950X3D, 4200 MHz
15779 KB/s +6%
Intel Core i9-13900K
i9-13900K, 3000 MHz
14836 KB/s 0%
AMD Ryzen 5 9600X
Ryzen 5 9600X, 3900 MHz
14819 KB/s
AMD Ryzen 9 5950X
R9 5950X, 3400 MHz
12503 KB/s -16%
Intel Core i5-14600K
i5-14600K, 3500 MHz
11491 KB/s -22%
Intel Core i5-13600K
i5-13600K, 3500 MHz
10937 KB/s -26%
Intel Core i9-12900K
i9-12900K, 3200 MHz
10792 KB/s -27%
Intel Core i5-13400
i5-13400, 2500 MHz
7979 KB/s -46%
Intel Core i5-12400F
i5-12400F, 2500 MHz
7816 KB/s -47%
Intel Core i5-12600K
i5-12600K, 2800 MHz
6239 KB/s -58%
TrueCrypt
AES Mean 100MB
AMD Ryzen 9 7950X
R9 7950X, 4500 MHz
30.7 GB/s +129%
Intel Core i9-13900K
i9-13900K, 3000 MHz
27 GB/s +101%
AMD Ryzen 9 5950X
R9 5950X, 3400 MHz
26.9 GB/s +101%
AMD Ryzen 9 7950X3D
R9 7950X3D, 4200 MHz
26.9 GB/s +101%
Intel Core i9-14900K
i9-14900K, 3200 MHz
26.7 GB/s +99%
Intel Core i5-14600K
i5-14600K, 3500 MHz
19.5 GB/s +46%
Intel Core i5-13600K
i5-13600K, 3500 MHz
18.8 GB/s +40%
Intel Core i9-12900K
i9-12900K, 3200 MHz
18.5 GB/s +38%
AMD Ryzen 7 7800X3D
R7 7800X3D, 4200 MHz
15.3 GB/s +14%
AMD Ryzen 9 7900X
R9 7900X, 4700 MHz
14.8 GB/s +10%
AMD Ryzen 5 9600X
Ryzen 5 9600X, 3900 MHz
13.4 GB/s
AMD Ryzen 5 7600X
R5 7600X, 4700 MHz
13.2 GB/s -1%
Intel Core i5-12600K
i5-12600K, 2800 MHz
12.8 GB/s -4%
Intel Core i5-13400
i5-13400, 2500 MHz
11.8 GB/s -12%
Intel Core i5-12400F
i5-12400F, 2500 MHz
9.3 GB/s -31%
Twofish Mean 100MB
Intel Core i9-14900K
i9-14900K, 3200 MHz
5.8 GB/s +164%
Intel Core i9-13900K
i9-13900K, 3000 MHz
5.4 GB/s +145%
AMD Ryzen 9 7950X
R9 7950X, 4500 MHz
4.5 GB/s +105%
AMD Ryzen 9 7950X3D
R9 7950X3D, 4200 MHz
4.2 GB/s +91%
AMD Ryzen 9 5950X
R9 5950X, 3400 MHz
3.7 GB/s +68%
Intel Core i9-12900K
i9-12900K, 3200 MHz
3.7 GB/s +68%
Intel Core i5-14600K
i5-14600K, 3500 MHz
3.4 GB/s +55%
Intel Core i5-13600K
i5-13600K, 3500 MHz
3.1 GB/s +41%
AMD Ryzen 9 7900X
R9 7900X, 4700 MHz
2.8 GB/s +27%
Intel Core i5-12600K
i5-12600K, 2800 MHz
2.2 GB/s 0%
AMD Ryzen 5 9600X
Ryzen 5 9600X, 3900 MHz
2.2 GB/s
AMD Ryzen 7 7800X3D
R7 7800X3D, 4200 MHz
2.1 GB/s -5%
Intel Core i5-13400
i5-13400, 2500 MHz
2 GB/s -9%
AMD Ryzen 5 7600X
R5 7600X, 4700 MHz
1.8 GB/s -18%
Intel Core i5-12400F
i5-12400F, 2500 MHz
1.4 GB/s -36%
Serpent Mean 100MB
Intel Core i9-13900K
i9-13900K, 3000 MHz
3 GB/s +114%
AMD Ryzen 9 7950X
R9 7950X, 4500 MHz
2.8 GB/s +100%
AMD Ryzen 9 7950X3D
R9 7950X3D, 4200 MHz
2.8 GB/s +100%
Intel Core i9-14900K
i9-14900K, 3200 MHz
2.8 GB/s +100%
AMD Ryzen 9 5950X
R9 5950X, 3400 MHz
2.4 GB/s +71%
Intel Core i9-12900K
i9-12900K, 3200 MHz
1.9 GB/s +36%
Intel Core i5-14600K
i5-14600K, 3500 MHz
1.8 GB/s +29%
Intel Core i5-13600K
i5-13600K, 3500 MHz
1.7 GB/s +21%
AMD Ryzen 9 7900X
R9 7900X, 4700 MHz
1.5 GB/s +7%
AMD Ryzen 5 9600X
Ryzen 5 9600X, 3900 MHz
1.4 GB/s
Intel Core i5-12600K
i5-12600K, 2800 MHz
1.3 GB/s -7%
AMD Ryzen 7 7800X3D
R7 7800X3D, 4200 MHz
1.3 GB/s -7%
Intel Core i5-13400
i5-13400, 2500 MHz
1.2 GB/s -14%
AMD Ryzen 5 7600X
R5 7600X, 4700 MHz
1.1 GB/s -21%
Intel Core i5-12400F
i5-12400F, 2500 MHz
0.884 GB/s -37%
Geekbench 5.5
Multi-Core
Intel Core i9-14900K
i9-14900K, 3200 MHz
25867 Points +103%
AMD Ryzen 9 7950X
R9 7950X, 4500 MHz
24625 Points +93%
AMD Ryzen 9 7950X3D
R9 7950X3D, 4200 MHz
24343 Points +91%
Intel Core i9-13900K
i9-13900K, 3000 MHz
24157 Points +89%
AMD Ryzen 9 7900X
R9 7900X, 4700 MHz
19987 Points +57%
Intel Core i9-12900K
i9-12900K, 3200 MHz
17854 Points +40%
Intel Core i5-14600K
i5-14600K, 3500 MHz
17516 Points +37%
AMD Ryzen 9 5950X
R9 5950X, 3400 MHz
16891 Points +32%
Intel Core i5-13600K
i5-13600K, 3500 MHz
16651 Points +31%
AMD Ryzen 7 7800X3D
R7 7800X3D, 4200 MHz
14252 Points +12%
Intel Core i5-12600K
i5-12600K, 2800 MHz
12797 Points 0%
AMD Ryzen 5 9600X
Ryzen 5 9600X, 3900 MHz
12751 Points
Intel Core i5-13400
i5-13400, 2500 MHz
12107 Points -5%
AMD Ryzen 5 7600X
R5 7600X, 4700 MHz
11917 Points -7%
Intel Core i5-12400F
i5-12400F, 2500 MHz
9517 Points -25%
Single-Core
AMD Ryzen 5 9600X
Ryzen 5 9600X, 3900 MHz
2523 Points
AMD Ryzen 9 7950X
R9 7950X, 4500 MHz
2311 Points -8%
AMD Ryzen 9 7950X3D
R9 7950X3D, 4200 MHz
2311 Points -8%
Intel Core i9-13900K
i9-13900K, 3000 MHz
2290 Points -9%
AMD Ryzen 9 7900X
R9 7900X, 4700 MHz
2274 Points -10%
Intel Core i9-14900K
i9-14900K, 3200 MHz
2243 Points -11%
AMD Ryzen 5 7600X
R5 7600X, 4700 MHz
2205 Points -13%
Intel Core i9-12900K
i9-12900K, 3200 MHz
2042 Points -19%
AMD Ryzen 7 7800X3D
R7 7800X3D, 4200 MHz
2027 Points -20%
Intel Core i5-14600K
i5-14600K, 3500 MHz
2017 Points -20%
Intel Core i5-13600K
i5-13600K, 3500 MHz
1967 Points -22%
Intel Core i5-12600K
i5-12600K, 2800 MHz
1904 Points -25%
Intel Core i5-13400
i5-13400, 2500 MHz
1795 Points -29%
Intel Core i5-12400F
i5-12400F, 2500 MHz
1742 Points -31%
AMD Ryzen 9 5950X
R9 5950X, 3400 MHz
1682 Points -33%
Geekbench 5.0
5.0 Multi-Core
Intel Core i9-14900K
i9-14900K, 3200 MHz
25459 Points +103%
AMD Ryzen 9 7950X
R9 7950X, 4500 MHz
24479 Points +95%
Intel Core i9-13900K
i9-13900K, 3000 MHz
24021 Points +91%
AMD Ryzen 9 7950X3D
R9 7950X3D, 4200 MHz
23720 Points +89%
AMD Ryzen 9 7900X
R9 7900X, 4700 MHz
19975 Points +59%
Intel Core i9-12900K
i9-12900K, 3200 MHz
17959 Points +43%
Intel Core i5-14600K
i5-14600K, 3500 MHz
17374 Points +38%
Intel Core i5-13600K
i5-13600K, 3500 MHz
16635 Points +32%
AMD Ryzen 9 5950X
R9 5950X, 3400 MHz
16570 Points +32%
AMD Ryzen 7 7800X3D
R7 7800X3D, 4200 MHz
13888 Points +11%
Intel Core i5-12600K
i5-12600K, 2800 MHz
12746 Points +2%
AMD Ryzen 5 9600X
Ryzen 5 9600X, 3900 MHz
12556 Points
AMD Ryzen 5 7600X
R5 7600X, 4700 MHz
11880 Points -5%
Intel Core i5-13400
i5-13400, 2500 MHz
11801 Points -6%
Intel Core i5-12400F
i5-12400F, 2500 MHz
9368 Points -25%
5.0 Single-Core
AMD Ryzen 5 9600X
Ryzen 5 9600X, 3900 MHz
2397 Points
Intel Core i9-14900K
i9-14900K, 3200 MHz
2272 Points -5%
AMD Ryzen 9 7950X
R9 7950X, 4500 MHz
2222 Points -7%
Intel Core i9-13900K
i9-13900K, 3000 MHz
2214 Points -8%
AMD Ryzen 9 7900X
R9 7900X, 4700 MHz
2194 Points -8%
AMD Ryzen 9 7950X3D
R9 7950X3D, 4200 MHz
2183 Points -9%
AMD Ryzen 5 7600X
R5 7600X, 4700 MHz
2126 Points -11%
Intel Core i5-14600K
i5-14600K, 3500 MHz
2004 Points -16%
Intel Core i9-12900K
i9-12900K, 3200 MHz
1968 Points -18%
AMD Ryzen 7 7800X3D
R7 7800X3D, 4200 MHz
1938 Points -19%
Intel Core i5-13600K
i5-13600K, 3500 MHz
1931 Points -19%
Intel Core i5-12600K
i5-12600K, 2800 MHz
1821 Points -24%
Intel Core i5-13400
i5-13400, 2500 MHz
1706 Points -29%
AMD Ryzen 9 5950X
R9 5950X, 3400 MHz
1683 Points -30%
Intel Core i5-12400F
i5-12400F, 2500 MHz
1673 Points -30%
Geekbench 4.4
64 Bit Single-Core Score
Intel Core i9-14900K
i9-14900K, 3200 MHz
9890 Points +1%
AMD Ryzen 5 9600X
Ryzen 5 9600X, 3900 MHz
9757 Points
Intel Core i9-13900K
i9-13900K, 3000 MHz
9598 Points -2%
AMD Ryzen 9 7950X
R9 7950X, 4500 MHz
9322 Points -4%
AMD Ryzen 9 7950X3D
R9 7950X3D, 4200 MHz
9240 Points -5%
AMD Ryzen 9 7900X
R9 7900X, 4700 MHz
9193 Points -6%
AMD Ryzen 7 7800X3D
R7 7800X3D, 4200 MHz
9097 Points -7%
AMD Ryzen 5 7600X
R5 7600X, 4700 MHz
8926 Points -9%
Intel Core i5-14600K
i5-14600K, 3500 MHz
8904 Points -9%
Intel Core i9-12900K
i9-12900K, 3200 MHz
8665 Points -11%
Intel Core i5-13600K
i5-13600K, 3500 MHz
8618 Points -12%
Intel Core i5-12600K
i5-12600K, 2800 MHz
8223 Points -16%
Intel Core i5-13400
i5-13400, 2500 MHz
7683 Points -21%
Intel Core i5-12400F
i5-12400F, 2500 MHz
7548 Points -23%
AMD Ryzen 9 5950X
R9 5950X, 3400 MHz
7216 Points -26%
64 Bit Multi-Core Score
AMD Ryzen 9 7950X
R9 7950X, 4500 MHz
89678 Points +74%
Intel Core i9-14900K
i9-14900K, 3200 MHz
89177 Points +73%
AMD Ryzen 9 7950X3D
R9 7950X3D, 4200 MHz
87922 Points +70%
Intel Core i9-13900K
i9-13900K, 3000 MHz
86695 Points +68%
AMD Ryzen 9 7900X
R9 7900X, 4700 MHz
74731 Points +45%
Intel Core i5-14600K
i5-14600K, 3500 MHz
64035 Points +24%
Intel Core i9-12900K
i9-12900K, 3200 MHz
63583 Points +23%
AMD Ryzen 9 5950X
R9 5950X, 3400 MHz
63233 Points +22%
Intel Core i5-13600K
i5-13600K, 3500 MHz
60407 Points +17%
AMD Ryzen 7 7800X3D
R7 7800X3D, 4200 MHz
54840 Points +6%
AMD Ryzen 5 9600X
Ryzen 5 9600X, 3900 MHz
51644 Points
AMD Ryzen 5 7600X
R5 7600X, 4700 MHz
47407 Points -8%
Intel Core i5-12600K
i5-12600K, 2800 MHz
46557 Points -10%
Intel Core i5-13400
i5-13400, 2500 MHz
42509 Points -18%
Intel Core i5-12400F
i5-12400F, 2500 MHz
35098 Points -32%
3DMark 11 - 1280x720 Performance Physics
AMD Ryzen 9 7950X3D
R9 7950X3D, 4200 MHz
36991 Points +44%
AMD Ryzen 7 7800X3D
R7 7800X3D, 4200 MHz
35127 Points +37%
Intel Core i9-13900K
i9-13900K, 3000 MHz
32273 Points +25%
Intel Core i9-14900K
i9-14900K, 3200 MHz
32188 Points +25%
Intel Core i5-14600K
i5-14600K, 3500 MHz
31641 Points +23%
Intel Core i5-13600K
i5-13600K, 3500 MHz
30480 Points +19%
AMD Ryzen 9 7900X
R9 7900X, 4700 MHz
28618 Points +11%
AMD Ryzen 9 7950X
R9 7950X, 4500 MHz
28618 Points +11%
Intel Core i9-12900K
i9-12900K, 3200 MHz
28211 Points +10%
AMD Ryzen 5 9600X
Ryzen 5 9600X, 3900 MHz
25717 Points
AMD Ryzen 5 7600X
R5 7600X, 4700 MHz
25396 Points -1%
AMD Ryzen 9 5950X
R9 5950X, 3400 MHz
25367 Points -1%
Intel Core i5-12600K
i5-12600K, 2800 MHz
25017 Points -3%
Intel Core i5-13400
i5-13400, 2500 MHz
23120 Points -10%
Intel Core i5-12400F
i5-12400F, 2500 MHz
19436 Points -24%
7-Zip 18.03
7z b 4
AMD Ryzen 9 7950X
R9 7950X, 4500 MHz
161724 MIPS +137%
AMD Ryzen 9 7950X3D
R9 7950X3D, 4200 MHz
159341 MIPS +134%
Intel Core i9-14900K
i9-14900K, 3200 MHz
149570 MIPS +119%
Intel Core i9-13900K
i9-13900K, 3000 MHz
147068 MIPS +116%
AMD Ryzen 9 5950X
R9 5950X, 3400 MHz
127792 MIPS +87%
AMD Ryzen 9 7900X
R9 7900X, 4700 MHz
124975 MIPS +83%
Intel Core i9-12900K
i9-12900K, 3200 MHz
97671 MIPS +43%
Intel Core i5-14600K
i5-14600K, 3500 MHz
93235 MIPS +37%
Intel Core i5-13600K
i5-13600K, 3500 MHz
89647 MIPS +31%
AMD Ryzen 7 7800X3D
R7 7800X3D, 4200 MHz
85067 MIPS +25%
AMD Ryzen 5 7600X
R5 7600X, 4700 MHz
69291 MIPS +2%
AMD Ryzen 5 9600X
Ryzen 5 9600X, 3900 MHz
68220 MIPS
Intel Core i5-12600K
i5-12600K, 2800 MHz
64260 MIPS -6%
Intel Core i5-13400
i5-13400, 2500 MHz
59510 MIPS -13%
Intel Core i5-12400F
i5-12400F, 2500 MHz
45043 MIPS -34%
7z b 4 -mmt1
AMD Ryzen 9 7950X
R9 7950X, 4500 MHz
8365 MIPS +7%
AMD Ryzen 9 7950X3D
R9 7950X3D, 4200 MHz
8321 MIPS +7%
AMD Ryzen 9 7900X
R9 7900X, 4700 MHz
8282 MIPS +6%
AMD Ryzen 7 7800X3D
R7 7800X3D, 4200 MHz
8235 MIPS +6%
AMD Ryzen 5 7600X
R5 7600X, 4700 MHz
8063 MIPS +3%
AMD Ryzen 5 9600X
Ryzen 5 9600X, 3900 MHz
7796 MIPS
Intel Core i9-14900K
i9-14900K, 3200 MHz
7772 MIPS 0%
Intel Core i9-13900K
i9-13900K, 3000 MHz
7272 MIPS -7%
AMD Ryzen 9 5950X
R9 5950X, 3400 MHz
6974 MIPS -11%
Intel Core i5-14600K
i5-14600K, 3500 MHz
6910 MIPS -11%
Intel Core i9-12900K
i9-12900K, 3200 MHz
6571 MIPS -16%
Intel Core i5-13600K
i5-13600K, 3500 MHz
6502 MIPS -17%
Intel Core i5-12600K
i5-12600K, 2800 MHz
5944 MIPS -24%
Intel Core i5-13400
i5-13400, 2500 MHz
5829 MIPS -25%
Intel Core i5-12400F
i5-12400F, 2500 MHz
5476 MIPS -30%
HWBOT x265 Benchmark v2.2 - 4k Preset
AMD Ryzen 9 7950X
R9 7950X, 4500 MHz
44.4 fps +91%
Intel Core i9-14900K
i9-14900K, 3200 MHz
42.8 fps +84%
Intel Core i9-13900K
i9-13900K, 3000 MHz
42.6 fps +84%
AMD Ryzen 9 7950X3D
R9 7950X3D, 4200 MHz
42.4 fps +83%
AMD Ryzen 9 7900X
R9 7900X, 4700 MHz
36.2 fps +56%
AMD Ryzen 9 5950X
R9 5950X, 3400 MHz
31.8 fps +37%
Intel Core i5-12600K
i5-12600K, 2800 MHz
30.1 fps +30%
Intel Core i9-12900K
i9-12900K, 3200 MHz
30 fps +29%
Intel Core i5-14600K
i5-14600K, 3500 MHz
28.6 fps +23%
Intel Core i5-13600K
i5-13600K, 3500 MHz
27.6 fps +19%
AMD Ryzen 7 7800X3D
R7 7800X3D, 4200 MHz
24.4 fps +5%
AMD Ryzen 5 9600X
Ryzen 5 9600X, 3900 MHz
23.2 fps
AMD Ryzen 5 7600X
R5 7600X, 4700 MHz
21.1 fps -9%
Intel Core i5-13400
i5-13400, 2500 MHz
19.1 fps -18%
Intel Core i5-12400F
i5-12400F, 2500 MHz
15.2 fps -34%
R Benchmark 2.5 - Overall mean
Intel Core i5-12400F
i5-12400F, 2500 MHz
0.4837 sec * -43%
Intel Core i5-13400
i5-13400, 2500 MHz
0.4654 sec * -37%
AMD Ryzen 9 5950X
R9 5950X, 3400 MHz
0.4556 sec * -34%
Intel Core i5-12600K
i5-12600K, 2800 MHz
0.4456 sec * -31%
Intel Core i9-12900K
i9-12900K, 3200 MHz
0.4216 sec * -24%
AMD Ryzen 7 7800X3D
R7 7800X3D, 4200 MHz
0.4152 sec * -23%
Intel Core i5-13600K
i5-13600K, 3500 MHz
0.405 sec * -20%
Intel Core i5-14600K
i5-14600K, 3500 MHz
0.3937 sec * -16%
AMD Ryzen 5 7600X
R5 7600X, 4700 MHz
0.3749 sec * -11%
AMD Ryzen 9 7900X
R9 7900X, 4700 MHz
0.3736 sec * -10%
AMD Ryzen 9 7950X3D
R9 7950X3D, 4200 MHz
0.372 sec * -10%
AMD Ryzen 9 7950X
R9 7950X, 4500 MHz
0.3682 sec * -9%
Intel Core i9-13900K
i9-13900K, 3000 MHz
0.3539 sec * -4%
Intel Core i9-14900K
i9-14900K, 3200 MHz
0.345 sec * -2%
AMD Ryzen 5 9600X
Ryzen 5 9600X, 3900 MHz
0.3389 sec *
LibreOffice - 20 Documents To PDF
Intel Core i5-12600K
i5-12600K, 2800 MHz
71.8 s * -55%
Intel Core i5-12400F
i5-12400F, 2500 MHz
46.5 s * -0%
AMD Ryzen 5 9600X
Ryzen 5 9600X, 3900 MHz
46.4 s *
AMD Ryzen 9 5950X
R9 5950X, 3400 MHz
45.97 s * +1%
AMD Ryzen 7 7800X3D
R7 7800X3D, 4200 MHz
40.7 s * +12%
Intel Core i9-12900K
i9-12900K, 3200 MHz
40.6 s * +12%
Intel Core i5-13400
i5-13400, 2500 MHz
38.7 s * +17%
AMD Ryzen 9 7950X3D
R9 7950X3D, 4200 MHz
38.6 s * +17%
AMD Ryzen 5 7600X
R5 7600X, 4700 MHz
36.8 s * +21%
Intel Core i9-13900K
i9-13900K, 3000 MHz
36.6 s * +21%
AMD Ryzen 9 7950X
R9 7950X, 4500 MHz
35.5 s * +23%
Intel Core i5-13600K
i5-13600K, 3500 MHz
35 s * +25%
AMD Ryzen 9 7900X
R9 7900X, 4700 MHz
34.9 s * +25%
Intel Core i9-14900K
i9-14900K, 3200 MHz
32.5 s * +30%
Intel Core i5-14600K
i5-14600K, 3500 MHz
31.9 s * +31%
WebXPRT 3 - Overall
AMD Ryzen 9 7950X3D
R9 7950X3D, 4200 MHz
383 Points +5%
Intel Core i9-14900K
i9-14900K, 3200 MHz
382 Points +5%
AMD Ryzen 9 7900X
R9 7900X, 4700 MHz
371 Points +2%
AMD Ryzen 9 7950X
R9 7950X, 4500 MHz
366 Points +1%
AMD Ryzen 5 9600X
Ryzen 5 9600X, 3900 MHz
364 Points
AMD Ryzen 5 7600X
R5 7600X, 4700 MHz
362 Points -1%
Intel Core i9-13900K
i9-13900K, 3000 MHz
361 Points -1%
Intel Core i5-14600K
i5-14600K, 3500 MHz
354 Points -3%
AMD Ryzen 7 7800X3D
R7 7800X3D, 4200 MHz
353 Points -3%
Intel Core i5-13600K
i5-13600K, 3500 MHz
333 Points -9%
Intel Core i9-12900K
i9-12900K, 3200 MHz
320 Points -12%
Intel Core i5-13400
i5-13400, 2500 MHz
306 Points -16%
Intel Core i5-12600K
i5-12600K, 2800 MHz
293 Points -20%
AMD Ryzen 9 5950X
R9 5950X, 3400 MHz
291 Points -20%
Intel Core i5-12400F
i5-12400F, 2500 MHz
272 Points -25%
Mozilla Kraken 1.1 - Total
Intel Core i5-12400F
i5-12400F, 2500 MHz
573 ms * -47%
AMD Ryzen 9 5950X
R9 5950X, 3400 MHz
558 ms * -43%
Intel Core i5-13400
i5-13400, 2500 MHz
535 ms * -38%
Intel Core i5-12600K
i5-12600K, 2800 MHz
511 ms * -31%
AMD Ryzen 7 7800X3D
R7 7800X3D, 4200 MHz
487 ms * -25%
Intel Core i9-12900K
i9-12900K, 3200 MHz
481 ms * -24%
Intel Core i5-13600K
i5-13600K, 3500 MHz
469 ms * -21%
Intel Core i5-14600K
i5-14600K, 3500 MHz
450 ms * -16%
AMD Ryzen 5 7600X
R5 7600X, 4700 MHz
441 ms * -13%
AMD Ryzen 9 7950X3D
R9 7950X3D, 4200 MHz
437 ms * -12%
AMD Ryzen 9 7950X
R9 7950X, 4500 MHz
433 ms * -11%
Intel Core i9-13900K
i9-13900K, 3000 MHz
432 ms * -11%
AMD Ryzen 9 7900X
R9 7900X, 4700 MHz
431 ms * -11%
Intel Core i9-14900K
i9-14900K, 3200 MHz
418 ms * -7%
AMD Ryzen 5 9600X
Ryzen 5 9600X, 3900 MHz
389 ms *
3DMark
3840x2160 Fire Strike Ultra Physics
Intel Core i9-14900K
i9-14900K, 3200 MHz
56405 Points +68%
Intel Core i9-13900K
i9-13900K, 3000 MHz
54036 Points +61%
AMD Ryzen 9 7950X3D
R9 7950X3D, 4200 MHz
44687 Points +33%
AMD Ryzen 9 7900X
R9 7900X, 4700 MHz
42399 Points +27%
AMD Ryzen 9 7950X
R9 7950X, 4500 MHz
42399 Points +27%
Intel Core i5-14600K
i5-14600K, 3500 MHz
40268 Points +20%
Intel Core i9-12900K
i9-12900K, 3200 MHz
39462 Points +18%
AMD Ryzen 9 5950X
R9 5950X, 3400 MHz
39353 Points +18%
Intel Core i5-13600K
i5-13600K, 3500 MHz
36774 Points +10%
AMD Ryzen 5 9600X
Ryzen 5 9600X, 3900 MHz
33490 Points
AMD Ryzen 7 7800X3D
R7 7800X3D, 4200 MHz
33346 Points 0%
AMD Ryzen 5 7600X
R5 7600X, 4700 MHz
30780 Points -8%
Intel Core i5-12600K
i5-12600K, 2800 MHz
29443 Points -12%
Intel Core i5-13400
i5-13400, 2500 MHz
27385 Points -18%
Intel Core i5-12400F
i5-12400F, 2500 MHz
23991 Points -28%
1920x1080 Fire Strike Physics
Intel Core i9-14900K
i9-14900K, 3200 MHz
56087 Points +68%
Intel Core i9-13900K
i9-13900K, 3000 MHz
53853 Points +61%
AMD Ryzen 9 7950X3D
R9 7950X3D, 4200 MHz
44787 Points +34%
AMD Ryzen 9 7900X
R9 7900X, 4700 MHz
42682 Points +28%
AMD Ryzen 9 7950X
R9 7950X, 4500 MHz
42682 Points +28%
Intel Core i5-14600K
i5-14600K, 3500 MHz
40164 Points +20%
AMD Ryzen 9 5950X
R9 5950X, 3400 MHz
39600 Points +18%
Intel Core i9-12900K
i9-12900K, 3200 MHz
39112 Points +17%
Intel Core i5-13600K
i5-13600K, 3500 MHz
35386 Points +6%
AMD Ryzen 5 9600X
Ryzen 5 9600X, 3900 MHz
33462 Points
AMD Ryzen 7 7800X3D
R7 7800X3D, 4200 MHz
33345 Points 0%
AMD Ryzen 5 7600X
R5 7600X, 4700 MHz
30691 Points -8%
Intel Core i5-12600K
i5-12600K, 2800 MHz
29671 Points -11%
Intel Core i5-13400
i5-13400, 2500 MHz
27135 Points -19%
Intel Core i5-12400F
i5-12400F, 2500 MHz
24023 Points -28%
2560x1440 Time Spy CPU
Intel Core i9-14900K
i9-14900K, 3200 MHz
23721 Points +119%
Intel Core i9-13900K
i9-13900K, 3000 MHz
19392 Points +79%
Intel Core i5-14600K
i5-14600K, 3500 MHz
18768 Points +73%
Intel Core i9-12900K
i9-12900K, 3200 MHz
18431 Points +70%
AMD Ryzen 9 7950X3D
R9 7950X3D, 4200 MHz
17206 Points +59%
Intel Core i5-13600K
i5-13600K, 3500 MHz
17124 Points +58%
AMD Ryzen 9 7900X
R9 7900X, 4700 MHz
16616 Points +54%
AMD Ryzen 9 7950X
R9 7950X, 4500 MHz
16616 Points +54%
AMD Ryzen 7 7800X3D
R7 7800X3D, 4200 MHz
14098 Points +30%
Intel Core i5-12600K
i5-12600K, 2800 MHz
13869 Points +28%
AMD Ryzen 9 5950X
R9 5950X, 3400 MHz
13650 Points +26%
Intel Core i5-13400
i5-13400, 2500 MHz
12948 Points +20%
AMD Ryzen 5 9600X
Ryzen 5 9600X, 3900 MHz
10821 Points
AMD Ryzen 5 7600X
R5 7600X, 4700 MHz
10458 Points -3%
Intel Core i5-12400F
i5-12400F, 2500 MHz
9745 Points -10%
Super Pi mod 1.5 XS 1M - 1M
Intel Core i5-12400F
i5-12400F, 2500 MHz
8.298 s * -9%
Intel Core i5-13400
i5-13400, 2500 MHz
8.033 s * -6%
AMD Ryzen 5 9600X
Ryzen 5 9600X, 3900 MHz
7.614 s *
AMD Ryzen 5 7600X
R5 7600X, 4700 MHz
7.423 s * +3%
Intel Core i5-12600K
i5-12600K, 2800 MHz
7.406 s * +3%
AMD Ryzen 7 7800X3D
R7 7800X3D, 4200 MHz
7.089 s * +7%
AMD Ryzen 9 5950X
R9 5950X, 3400 MHz
7.065 s * +7%
Intel Core i9-12900K
i9-12900K, 3200 MHz
7.063 s * +7%
Intel Core i5-13600K
i5-13600K, 3500 MHz
6.58 s * +14%
Intel Core i5-14600K
i5-14600K, 3500 MHz
6.234 s * +18%
AMD Ryzen 9 7900X
R9 7900X, 4700 MHz
6.141 s * +19%
AMD Ryzen 9 7950X3D
R9 7950X3D, 4200 MHz
6.109 s * +20%
AMD Ryzen 9 7950X
R9 7950X, 4500 MHz
6.088 s * +20%
Intel Core i9-13900K
i9-13900K, 3000 MHz
5.655 s * +26%
Intel Core i9-14900K
i9-14900K, 3200 MHz
5.476 s * +28%
Super Pi mod 1.5 XS 2M - 2M
Intel Core i5-12400F
i5-12400F, 2500 MHz
18.473 s * -13%
Intel Core i5-13400
i5-13400, 2500 MHz
17.963 s * -10%
Intel Core i5-12600K
i5-12600K, 2800 MHz
16.42 s * -0%
AMD Ryzen 5 9600X
Ryzen 5 9600X, 3900 MHz
16.363 s *
AMD Ryzen 5 7600X
R5 7600X, 4700 MHz
15.954 s * +2%
Intel Core i9-12900K
i9-12900K, 3200 MHz
15.59 s * +5%
AMD Ryzen 7 7800X3D
R7 7800X3D, 4200 MHz
15.335 s * +6%
AMD Ryzen 9 5950X
R9 5950X, 3400 MHz
15.28 s * +7%
Intel Core i5-13600K
i5-13600K, 3500 MHz
14.876 s * +9%
Intel Core i5-14600K
i5-14600K, 3500 MHz
13.657 s * +17%
AMD Ryzen 9 7950X
R9 7950X, 4500 MHz
13.291 s * +19%
AMD Ryzen 9 7900X
R9 7900X, 4700 MHz
13.251 s * +19%
Intel Core i9-13900K
i9-13900K, 3000 MHz
13.193 s * +19%
AMD Ryzen 9 7950X3D
R9 7950X3D, 4200 MHz
13.189 s * +19%
Intel Core i9-14900K
i9-14900K, 3200 MHz
11.996 s * +27%
Super Pi Mod 1.5 XS 32M - 32M
Intel Core i5-12400F
i5-12400F, 2500 MHz
438.444 s * -22%
Intel Core i5-13400
i5-13400, 2500 MHz
427.158 s * -19%
AMD Ryzen 5 7600X
R5 7600X, 4700 MHz
367.068 s * -2%
Intel Core i5-12600K
i5-12600K, 2800 MHz
363.2 s * -1%
AMD Ryzen 5 9600X
Ryzen 5 9600X, 3900 MHz
360.414 s *
AMD Ryzen 9 5950X
R9 5950X, 3400 MHz
349.3 s * +3%
Intel Core i9-12900K
i9-12900K, 3200 MHz
338.6 s * +6%
AMD Ryzen 7 7800X3D
R7 7800X3D, 4200 MHz
337.57 s * +6%
Intel Core i5-13600K
i5-13600K, 3500 MHz
328.929 s * +9%
Intel Core i5-14600K
i5-14600K, 3500 MHz
316.69 s * +12%
AMD Ryzen 9 7900X
R9 7900X, 4700 MHz
313.437 s * +13%
AMD Ryzen 9 7950X
R9 7950X, 4500 MHz
309.009 s * +14%
AMD Ryzen 9 7950X3D
R9 7950X3D, 4200 MHz
305.11 s * +15%
Intel Core i9-13900K
i9-13900K, 3000 MHz
290.571 s * +19%
Intel Core i9-14900K
i9-14900K, 3200 MHz
280.25 s * +22%

* ... menor é melhor
Cinebench R15 Multi continuous test

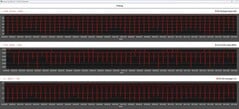
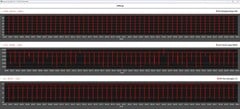
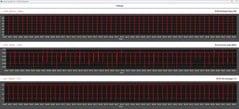
O baixo consumo de energia do AMD Ryzen 5 9600X não exige muito da unidade de resfriamento do sistema. Durante nosso teste de resistência, observamos que nenhum dos modelos que já testamos teve que enfrentar perdas significativas de desempenho. No entanto, quando se tratava de processadores móveis, as coisas muitas vezes pareciam diferentes. Com uma média de 2.623 pontos, ele conseguiu superar os resultados de um Intel Core i5-12600K.

Cinebench R15
Cinebench R15
Cinebench R20
Cinebench R20
Cinebench R23
Cinebench R23
1723.61923.62123.62323.62523.62723.62923.63123.63323.63523.63723.63923.64123.64323.64523.64723.64923.65123.65323.65523.65723.65923.66123.6Tooltip
AMD Ryzen 5 9600X AMD Ryzen 5 9600X, AMD Ryzen 5 9600X: Ø2623 (2586.99-2654.28)
Intel Core i9-13900K Intel Core i9-13900K, Intel Core i9-13900K: Ø6182 (6045.95-6213.11)
NVIDIA GeForce RTX 3090 Founders Edition AMD Ryzen 9 7950X, AMD Ryzen 9 7950X: Ø6154 (6136.85-6189.08)
Intel Core i5-13600K Intel Core i5-13600K, Intel Core i5-13600K: Ø3620 (3607.83-3632.07)
AMD Ryzen 5 7600X AMD Ryzen 5 7600X, AMD Ryzen 5 7600X: Ø2468 (2440.21-2487.56)
Intel Core i9-12900K Intel Core i9-12900K, Intel Core i9-12900K: Ø3987 (3920.42-4037.55)
Intel Core i5-12600K Intel Core i5-12600K, Intel Core i5-12600K: Ø2545 (2497.35-2570.36)
AMD Ryzen 7 7800X3D AMD Ryzen 7 7800X3D, AMD Ryzen 7 7800X3D: Ø2967 (2917.15-3006.39)
AMD Ryzen 9 7900X AMD Ryzen 9 7900X, AMD Ryzen 9 7900X: Ø4785 (4739.9-4829.17)
Intel Core i5-13400 Intel Core i5-13400, Intel Core i5-13400: Ø2328 (2286.5-2356.27)
Intel Core i5-12400F Intel Core i5-12400F, Intel Core i5-12400F: Ø1754 (1723.62-1775.1)
AMD Ryzen 9 5950X AMD Ryzen 9 5950X, AMD Ryzen 9 5950X: Ø4467 (4442.47-4510.09)
AMD Ryzen 9 7950X3D AMD Ryzen 9 7950X3D, AMD Ryzen 9 7950X3D: Ø5942 (5923.29-5966.59)
Palit GeForce RTX 4090 GameRock OC Intel Core i9-14900K, Intel Core i9-14900K: Ø6068 (5924.17-6110.6)
Intel Core i5-14600K Intel Core i5-14600K, Intel Core i5-14600K: Ø3640 (3622.86-3654.64)

Benchmarks sintéticos e desempenho de aplicativos

Nos benchmarks sintéticos, o AMD Ryzen 5 9600X impressionou apenas em benchmarks individuais. Esperávamos um pouco mais aqui, especialmente durante os testes de RAM. Lá, nossa amostra de teste ficou atrás até mesmo do AMD Ryzen 5 7600X. No entanto, o senhor provavelmente não notará muito isso no uso diário. Para fins de integridade, é preciso mencionar que foram usadas diferentes versões do AIDA64. A versão usada atualmente é a AIDA64 v6.92.6600 com o módulo de referência 4.6.882.8-x64.

PCMark 10 - Score
Intel Core i9-14900K
10101 Points 0%
AMD Ryzen 5 9600X
10060 Points
AMD Ryzen 9 7900X
9911 Points -1%
AMD Ryzen 9 7950X
9911 Points -1%
Intel Core i9-13900K
9788 Points -3%
Intel Core i5-14600K
9587 Points -5%
AMD Ryzen 7 7800X3D
9500 Points -6%
AMD Ryzen 5 7600X
9470 Points -6%
Intel Core i5-13600K
9362 Points -7%
AMD Ryzen 9 5950X
8778 Points -13%
Intel Core i5-13400
8614 Points -14%
Intel Core i9-12900K
8604 Points -14%
Intel Core i5-12600K
8259 Points -18%
Intel Core i5-12400F
7756 Points -23%
3DMark
1920x1080 Fire Strike Physics
Intel Core i9-14900K
56087 Points +68%
Intel Core i9-13900K
53853 Points +61%
AMD Ryzen 9 7950X3D
44787 Points +34%
AMD Ryzen 9 7900X
42682 Points +28%
AMD Ryzen 9 7950X
42682 Points +28%
Intel Core i5-14600K
40164 Points +20%
AMD Ryzen 9 5950X
39600 Points +18%
Intel Core i9-12900K
39112 Points +17%
Intel Core i5-13600K
35386 Points +6%
AMD Ryzen 5 9600X
33462 Points
AMD Ryzen 7 7800X3D
33345 Points 0%
AMD Ryzen 5 7600X
30691 Points -8%
Intel Core i5-12600K
29671 Points -11%
Intel Core i5-13400
27135 Points -19%
Intel Core i5-12400F
24023 Points -28%
2560x1440 Time Spy CPU
Intel Core i9-14900K
23721 Points +119%
Intel Core i9-13900K
19392 Points +79%
Intel Core i5-14600K
18768 Points +73%
Intel Core i9-12900K
18431 Points +70%
AMD Ryzen 9 7950X3D
17206 Points +59%
Intel Core i5-13600K
17124 Points +58%
AMD Ryzen 9 7900X
16616 Points +54%
AMD Ryzen 9 7950X
16616 Points +54%
AMD Ryzen 7 7800X3D
14098 Points +30%
Intel Core i5-12600K
13869 Points +28%
AMD Ryzen 9 5950X
13650 Points +26%
Intel Core i5-13400
12948 Points +20%
AMD Ryzen 5 9600X
10821 Points
AMD Ryzen 5 7600X
10458 Points -3%
Intel Core i5-12400F
9745 Points -10%
3DMark 11 - 1280x720 Performance Physics
AMD Ryzen 9 7950X3D
36991 Points +44%
AMD Ryzen 7 7800X3D
35127 Points +37%
Intel Core i9-13900K
32273 Points +25%
Intel Core i9-14900K
32188 Points +25%
Intel Core i5-14600K
31641 Points +23%
Intel Core i5-13600K
30480 Points +19%
AMD Ryzen 9 7900X
28618 Points +11%
AMD Ryzen 9 7950X
28618 Points +11%
Intel Core i9-12900K
28211 Points +10%
AMD Ryzen 5 9600X
25717 Points
AMD Ryzen 5 7600X
25396 Points -1%
AMD Ryzen 9 5950X
25367 Points -1%
Intel Core i5-12600K
25017 Points -3%
Intel Core i5-13400
23120 Points -10%
Intel Core i5-12400F
19436 Points -24%
CrossMark - Overall
Intel Core i9-14900K
2611 Points +24%
Intel Core i9-13900K
2589 Points +23%
AMD Ryzen 9 7950X
2512 Points +19%
AMD Ryzen 9 7900X
2405 Points +14%
Intel Core i5-14600K
2310 Points +10%
Intel Core i5-13600K
2271 Points +8%
AMD Ryzen 5 7600X
2236 Points +6%
AMD Ryzen 7 7800X3D
2216 Points +5%
AMD Ryzen 9 7950X3D
2193 Points +4%
AMD Ryzen 5 9600X
2103 Points
Intel Core i5-13400
1877 Points -11%
Intel Core i5-12400F
1762 Points -16%
AMD Ryzen 9 5950X
1495 Points -29%
Performance Rating
Intel Core i9-14900K
78.6 pt
Intel Core i5-14600K
76.4 pt
AMD Ryzen 9 7950X3D
73.5 pt
AMD Ryzen 9 7950X
71.9 pt
AMD Ryzen 9 7900X
68.7 pt
Intel Core i9-13900K
68 pt
Intel Core i5-13400
65.3 pt
AMD Ryzen 7 7800X3D
65.2 pt
Intel Core i5-12400F
63.5 pt
Intel Core i5-13600K
63.4 pt
AMD Ryzen 5 7600X
62.8 pt
AMD Ryzen 5 9600X
60 pt
AMD Ryzen 9 5950X
53.2 pt
Média da turma
42.2 pt
AIDA64 / Memory Copy
Intel Core i9-14900K
85662 MB/s +55%
Intel Core i5-14600K
82790 MB/s +50%
Intel Core i9-13900K
74937 MB/s +36%
AMD Ryzen 9 7950X3D
73868 MB/s +34%
AMD Ryzen 9 7950X
73104 MB/s +33%
Intel Core i5-13400
71766 MB/s +30%
Intel Core i5-13600K
71725 MB/s +30%
Intel Core i5-12400F
71074 MB/s +29%
AMD Ryzen 9 7900X
69140 MB/s +25%
AMD Ryzen 7 7800X3D
63242 MB/s +15%
AMD Ryzen 5 7600X
59949 MB/s +9%
AMD Ryzen 9 5950X
59171 MB/s +7%
AMD Ryzen 5 9600X
55115 MB/s
Média da turma (4514 - 234662, n=1808)
48508 MB/s -12%
AIDA64 / Memory Read
Intel Core i9-14900K
95232 MB/s +61%
Intel Core i5-14600K
88793 MB/s +50%
Intel Core i9-13900K
83883 MB/s +42%
AMD Ryzen 9 7950X3D
80946 MB/s +37%
AMD Ryzen 9 7950X
78282 MB/s +33%
Intel Core i5-13400
77867 MB/s +32%
Intel Core i5-13600K
75757 MB/s +28%
AMD Ryzen 9 7900X
75338 MB/s +28%
Intel Core i5-12400F
74338 MB/s +26%
AMD Ryzen 9 5950X
62991 MB/s +7%
AMD Ryzen 7 7800X3D
62528 MB/s +6%
AMD Ryzen 5 9600X
59008 MB/s
AMD Ryzen 5 7600X
59007 MB/s 0%
Média da turma (4031 - 271066, n=1769)
50909 MB/s -14%
AIDA64 / Memory Write
AMD Ryzen 7 7800X3D
87412 MB/s +8%
AMD Ryzen 9 7950X3D
85951 MB/s +6%
Intel Core i5-14600K
84101 MB/s +4%
Intel Core i9-14900K
83670 MB/s +4%
AMD Ryzen 5 7600X
81320 MB/s +1%
AMD Ryzen 5 9600X
80805 MB/s
AMD Ryzen 9 7950X
79843 MB/s -1%
AMD Ryzen 9 7900X
76967 MB/s -5%
Intel Core i9-13900K
74140 MB/s -8%
Intel Core i5-13400
74029 MB/s -8%
Intel Core i5-12400F
73805 MB/s -9%
Intel Core i5-13600K
73484 MB/s -9%
Média da turma (3506 - 242868, n=1774)
51401 MB/s -36%
AMD Ryzen 9 5950X
48748 MB/s -40%
AIDA64 / Memory Latency
Média da turma (6.9 - 346, n=1844)
86.6 ns * -27%
Intel Core i5-13600K
81.1 ns * -19%
Intel Core i5-12400F
79.2 ns * -16%
Intel Core i5-13400
77.2 ns * -13%
Intel Core i9-13900K
76.5 ns * -12%
Intel Core i9-14900K
70.3 ns * -3%
Intel Core i5-14600K
69.7 ns * -2%
AMD Ryzen 5 9600X
68.1 ns *
AMD Ryzen 7 7800X3D
68 ns * -0%
AMD Ryzen 9 5950X
67.7 ns * +1%
AMD Ryzen 9 7950X3D
65.6 ns * +4%
AMD Ryzen 5 7600X
63.8 ns * +6%
AMD Ryzen 9 7900X
63.3 ns * +7%
AMD Ryzen 9 7950X
61.7 ns * +9%

* ... menor é melhor
Benchmarks de jogos

AMD Ryzen 5 9600X vs. Intel Core i5-14600K (fonte: AMD)

O aspecto positivo de seu excelente desempenho de núcleo único ajudou imensamente o AMD Ryzen 5 9600X durante os testes de jogos: Em seu duelo com a 14ª geração da Intel, medimos uma clara vantagem sobre o Intel Core i5-14600K, embora o Intel Core i9-14900K tenha sido apenas um pouco mais rápido. A própria AMD escolheu o Intel Core i5-14600K como oponente direto do Ryzen 5 9600X, como o senhor pode ver na captura de tela. O Ryzen 7 7800X3D ainda é o modelo mais rápido atualmente em seu portfólio. Testamos todos os modelos com uma Palit GeForce RTX 4090 GameRock OC. Se isso for feito em resolução 4K e com o máximo de detalhes, não há diferença perceptível entre todos os processadores nesta comparação. Em suma, o senhor pode jogar todos os jogos sem problemas com o AMD Ryzen 5 9600X em combinação com uma Nvidia GeForce RTX 4090. No entanto, se o senhor quiser compartilhar seu conteúdo ao vivo por meio de várias plataformas, poderá correr o risco de a CPU se tornar um gargalo. Afinal de contas, trata-se de um modelo de apenas 6 núcleos.

Mesmo assim, a AMD está dificultando sua vida com o AMD Ryzen 7 7800X3D. Ele oferece um desempenho significativamente maior em jogos, e o ponto decisivo será o preço. Por fim, seu consumo de energia também pode fazer uma diferença fundamental, já que o modelo X3D com oito núcleos é especificado em 120 watts.

Performance Rating - Percent
AMD Ryzen 7 7800X3D
99.3 pt
AMD Ryzen 9 7950X3D
91.6 pt
Intel Core i9-14900K
90.4 pt
AMD Ryzen 5 9600X
86.8 pt
AMD Ryzen 9 7950X
85.1 pt
Intel Core i9-13900K
84.3 pt
AMD Ryzen 5 7600X
83.9 pt
Intel Core i5-14600K
81.7 pt
Intel Core i7-13700K
78.4 pt
Intel Core i7-13700
77.5 pt
Intel Core i7-12700
67 pt
Intel Core i5-13400
59 pt
Intel Core i5-12400F
57.8 pt
F1 22
1920x1080 Low Preset AA:T AF:16x
AMD Ryzen 7 7800X3D
533 (380min, 288P1 - 637max) fps +21%
AMD Ryzen 9 7950X3D
475 (338min, 264P1 - 542max) fps +8%
Intel Core i9-14900K
462 (309min, 256P1 - 558max) fps +5%
AMD Ryzen 9 7950X
443 (278min, 245P1 - 521max) fps +1%
AMD Ryzen 5 9600X
439 (256min, 238P1 - 510max) fps
AMD Ryzen 5 7600X
417 (281min, 236P1 - 488max) fps -5%
Intel Core i9-13900K
401 (265min, 222P1 - 463max) fps -9%
Intel Core i7-13700K
380 (280min, 217P1 - 437max) fps -13%
Intel Core i5-14600K
379 (280min, 225P1 - 455max) fps -14%
Intel Core i7-13700
378 (244min, 212P1 - 430max) fps -14%
Intel Core i7-12700
313 (235min, 185P1 - 364max) fps -29%
Intel Core i5-12400F
271 (200min, 165P1 - 305max) fps -38%
Intel Core i5-13400
249 (197min, 152P1 - 284max) fps -43%
1920x1080 Ultra High Preset AA:T AF:16x
AMD Ryzen 7 7800X3D
221 (196min, 145P1 - 248max) fps +9%
Intel Core i9-14900K
217 (156min, 142P1 - 244max) fps +7%
Intel Core i5-14600K
210 (169min, 140P1 - 237max) fps +4%
AMD Ryzen 5 7600X
205 (168min, 137P1 - 229max) fps +1%
AMD Ryzen 9 7950X3D
204 (138min, 120P1 - 232max) fps +1%
AMD Ryzen 5 9600X
202 (157min, 133P1 - 233max) fps
AMD Ryzen 9 7950X
194.5 fps -4%
Intel Core i9-13900K
193.4 (156min, 125P1 - 214max) fps -4%
Intel Core i7-13700K
189.3 (155min, 125P1 - 207max) fps -6%
Intel Core i7-13700
186.4 (158min, 124P1 - 208max) fps -8%
Intel Core i7-12700
163.5 (135min, 106P1 - 180max) fps -19%
Intel Core i5-12400F
149 (120min, 99P1 - 165max) fps -26%
Intel Core i5-13400
148.7 (114min, 95P1 - 173max) fps -26%
Far Cry 5
1920x1080 Ultra Preset AA:T
AMD Ryzen 7 7800X3D
278 (200min - 402max) fps +37%
AMD Ryzen 9 7950X3D
248 (186min - 370max) fps +22%
Intel Core i9-14900K
217 (159min - 296max) fps +7%
Intel Core i9-13900K
207 (152min - 283max) fps +2%
AMD Ryzen 5 9600X
203 (152min - 277max) fps
Intel Core i5-14600K
196 (146min - 270max) fps -3%
AMD Ryzen 9 7950X
188 (136min - 253max) fps -7%
AMD Ryzen 5 7600X
187 (141min - 258max) fps -8%
Intel Core i7-13700
185 (139min - 251max) fps -9%
Intel Core i7-13700K
185 (144min - 254max) fps -9%
Intel Core i7-12700
156 (117min - 213max) fps -23%
Intel Core i5-13400
144 (109min - 202max) fps -29%
Intel Core i5-12400F
133 (103min - 180max) fps -34%
1280x720 Low Preset AA:T
AMD Ryzen 7 7800X3D
344 (220min - 464max) fps +31%
AMD Ryzen 9 7950X3D
299 (201min - 390max) fps +14%
Intel Core i9-14900K
280 (214min - 355max) fps +6%
Intel Core i9-13900K
270 (203min - 349max) fps +3%
AMD Ryzen 5 9600X
263 (201min - 342max) fps
Intel Core i5-14600K
255 (199min - 343max) fps -3%
Intel Core i7-13700K
242 (183min - 317max) fps -8%
AMD Ryzen 5 7600X
241 (180min - 334max) fps -8%
AMD Ryzen 9 7950X
238 (182min - 313max) fps -10%
Intel Core i7-13700
232 (161min - 306max) fps -12%
Intel Core i7-12700
204 (156min - 270max) fps -22%
Intel Core i5-13400
185 (144min - 241max) fps -30%
Intel Core i5-12400F
173 (124min - 232max) fps -34%
X-Plane 11.11
1920x1080 high (fps_test=3)
AMD Ryzen 7 7800X3D
188.1 fps +13%
AMD Ryzen 9 7950X3D
187.1 fps +13%
AMD Ryzen 5 9600X
166.1 fps
Intel Core i9-14900K
161 fps -3%
Intel Core i9-13900K
159.5 fps -4%
AMD Ryzen 9 7950X
151.6 fps -9%
AMD Ryzen 5 7600X
148.5 fps -11%
Intel Core i5-14600K
147.8 fps -11%
Intel Core i7-13700K
144 fps -13%
Intel Core i7-13700
142.1 fps -14%
Intel Core i7-12700
122.1 fps -26%
Intel Core i5-13400
108.9 fps -34%
Intel Core i5-12400F
100.8 fps -39%
1280x720 low (fps_test=1)
Intel Core i9-13900K
245 fps 0%
AMD Ryzen 5 9600X
245 fps
Intel Core i9-14900K
244 fps 0%
Intel Core i5-14600K
228 fps -7%
AMD Ryzen 9 7950X3D
225 fps -8%
Intel Core i7-13700K
224 fps -9%
AMD Ryzen 9 7950X
223 fps -9%
AMD Ryzen 7 7800X3D
219 fps -11%
Intel Core i7-13700
218 fps -11%
AMD Ryzen 5 7600X
217 fps -11%
Intel Core i7-12700
181.4 fps -26%
Intel Core i5-13400
155.7 fps -36%
Intel Core i5-12400F
113 fps -54%
Final Fantasy XV Benchmark
1920x1080 High Quality
Intel Core i9-14900K
234 fps +2%
AMD Ryzen 9 7950X
233 fps +2%
AMD Ryzen 7 7800X3D
233 fps +2%
Intel Core i5-14600K
233 fps +2%
Intel Core i9-13900K
232 fps +1%
AMD Ryzen 9 7950X3D
232 fps +1%
AMD Ryzen 5 9600X
229 fps
Intel Core i7-13700K
227 fps -1%
AMD Ryzen 5 7600X
225 fps -2%
Intel Core i7-13700
225 fps -2%
Intel Core i7-12700
204 fps -11%
Intel Core i5-13400
183.9 fps -20%
Intel Core i5-12400F
175.9 fps -23%
1280x720 Lite Quality
AMD Ryzen 5 9600X
237 fps
Intel Core i9-13900K
236 fps 0%
AMD Ryzen 9 7950X
236 fps 0%
AMD Ryzen 5 7600X
236 fps 0%
Intel Core i7-13700
236 fps 0%
Intel Core i7-13700K
236 fps 0%
AMD Ryzen 7 7800X3D
236 fps 0%
Intel Core i5-14600K
236 fps 0%
Intel Core i9-14900K
235 fps -1%
AMD Ryzen 9 7950X3D
234 fps -1%
Intel Core i7-12700
232 fps -2%
Intel Core i5-12400F
217 fps -8%
Intel Core i5-13400
217 fps -8%
Dota 2 Reborn
1920x1080 ultra (3/3) best looking
AMD Ryzen 7 7800X3D
267.5 (216.9min) fps +15%
AMD Ryzen 9 7950X3D
252.7 (208.9min) fps +8%
AMD Ryzen 9 7950X
239.2 (203.6min) fps +3%
Intel Core i9-13900K
235 (199.1min) fps +1%
AMD Ryzen 5 9600X
233 (200min) fps
Intel Core i9-14900K
231.4 (197.9min) fps -1%
AMD Ryzen 5 7600X
224.3 (189min) fps -4%
Intel Core i5-14600K
217 (186.1min) fps -7%
Intel Core i7-13700K
204 (175.6min) fps -12%
Intel Core i7-13700
198.4 (172.2min) fps -15%
Intel Core i7-12700
168 (146.7min) fps -28%
Intel Core i5-13400
153.8 (133.2min) fps -34%
Intel Core i5-12400F
153.7 (134.4min) fps -34%
1280x720 min (0/3) fastest
AMD Ryzen 7 7800X3D
322.9 (268min) fps +11%
AMD Ryzen 9 7950X3D
314.1 (261.7min) fps +8%
AMD Ryzen 9 7950X
310.6 (261.3min) fps +7%
Intel Core i9-14900K
299.9 (248.4min) fps +3%
Intel Core i9-13900K
294 (254.9min) fps +1%
AMD Ryzen 5 9600X
291 (244.2min) fps
AMD Ryzen 5 7600X
278.1 (211.4min) fps -4%
Intel Core i5-14600K
261.5 (226.3min) fps -10%
Intel Core i7-13700K
251.2 (215.9min) fps -14%
Intel Core i7-13700
245 (213.8min) fps -16%
Intel Core i7-12700
202.4 (178min) fps -30%
Intel Core i5-12400F
182.1 (159.5min) fps -37%
Intel Core i5-13400
182.1 (160.5min) fps -37%
The Witcher 3
1920x1080 Ultra Graphics & Postprocessing (HBAO+)
Intel Core i9-13900K
328 (32.3min, 171.4P0.1, 245P1 - 572max) fps +15%
AMD Ryzen 9 7950X
320 (30min, 161.1P0.1, 244P1 - 595max) fps +12%
Intel Core i5-14600K
316 (105.2min, 154.9P0.1, 222P1 - 551max) fps +10%
AMD Ryzen 7 7800X3D
314.3 fps +10%
Intel Core i9-14900K
314 (65.8min, 172.6P0.1, 242P1 - 579max) fps +10%
AMD Ryzen 5 7600X
313 fps +9%
Intel Core i7-13700K
307.7 fps +8%
Intel Core i7-13700
305.2 fps +7%
AMD Ryzen 9 7950X3D
305 fps +7%
Intel Core i7-12700
301 fps +5%
AMD Ryzen 5 9600X
286 (74.6min, 128.5P0.1, 200P1 - 609max) fps
Intel Core i5-13400
277.3 fps -3%
Intel Core i5-12400F
276 fps -3%
1024x768 Low Graphics & Postprocessing
AMD Ryzen 9 7950X3D
864.7 fps +13%
AMD Ryzen 7 7800X3D
858.4 fps +13%
Intel Core i9-14900K
829 (31.9min, 380P0.1, 595P1 - 1296max) fps +9%
AMD Ryzen 9 7950X
826 (23.6min, 360P0.1, 574P1 - 1357max) fps +8%
Intel Core i9-13900K
794 (25.1min, 361P0.1, 581P1 - 1267max) fps +4%
AMD Ryzen 5 9600X
762 (66min, 266P0.1, 520P1 - 1355max) fps
AMD Ryzen 5 7600X
738 fps -3%
Intel Core i7-13700K
687.5 fps -10%
Intel Core i7-13700
670.4 fps -12%
Intel Core i5-14600K
632 (29.4min, 209P0.1, 471P1 - 1028max) fps -17%
Intel Core i7-12700
522 fps -31%
Intel Core i5-13400
451.7 fps -41%
Intel Core i5-12400F
414 fps -46%
GTA V
1920x1080 Highest Settings possible AA:4xMSAA + FX AF:16x
AMD Ryzen 7 7800X3D
182 (2.73min, 142.9P1 - 445max) fps +9%
Intel Core i9-14900K
170.9 (3.95min, 142.9P1 - 448max) fps +3%
Intel Core i9-13900K
168.9 (5.18min, 125P1 - 364max) fps +2%
AMD Ryzen 5 9600X
166.3 (2.04min, 125P1 - 360max) fps
Intel Core i5-14600K
162.3 (14.2min, 125P1 - 354max) fps -2%
AMD Ryzen 9 7950X
162 (3.52min, 111.1P1 - 353max) fps -3%
AMD Ryzen 9 7950X3D
160.2 (11.4min, 111.1P1 - 366max) fps -4%
Intel Core i7-13700K
158.2 (13.6min, 125P1 - 338max) fps -5%
AMD Ryzen 5 7600X
155.6 (8.2min, 111.1P1 - 278max) fps -6%
Intel Core i7-13700
154.2 (6.9min, 111.1P1 - 312max) fps -7%
Intel Core i7-12700
135.4 (13.2min, 100P1 - 202max) fps -19%
Intel Core i5-13400
124.5 (13.2min, 90.9P1 - 267max) fps -25%
Intel Core i5-12400F
118.7 (4.84min, 83.3P1 - 208max) fps -29%
1024x768 Lowest Settings possible
AMD Ryzen 7 7800X3D
188.5 fps 0%
AMD Ryzen 9 7950X
188.2 (5.44min, 200P1 - 724max) fps 0%
AMD Ryzen 5 9600X
188.1 (3min, 200P1 - 713max) fps
AMD Ryzen 9 7950X3D
188 (3.25min, 200P1 - 705max) fps 0%
AMD Ryzen 5 7600X
187.9 (7.22min, 200P1 - 815max) fps 0%
Intel Core i9-14900K
187.9 (3.8min, 200P1 - 705max) fps 0%
Intel Core i9-13900K
187.8 (2.26min, 200P1 - 688max) fps 0%
Intel Core i7-13700
187.7 (5.01min, 200P1 - 613max) fps 0%
Intel Core i5-14600K
187.7 (4.67min, 200P1 - 640max) fps 0%
Intel Core i7-13700K
187.6 (3.74min, 200P1 - 607max) fps 0%
Intel Core i7-12700
187.1 (2.4min, 200P1 - 499max) fps -1%
Intel Core i5-13400
186.8 (1.87min, 166.7P1 - 445max) fps -1%
Intel Core i5-12400F
186.4 (2.09min, 166.7P1 - 413max) fps -1%
Borderlands 3
1280x720 Very Low Overall Quality (DX11)
AMD Ryzen 7 7800X3D
310 fps +36%
AMD Ryzen 9 7950X3D
308 fps +35%
Intel Core i9-14900K
263 fps +15%
Intel Core i9-13900K
243 fps +7%
AMD Ryzen 9 7950X
242 fps +6%
Intel Core i5-14600K
237 fps +4%
AMD Ryzen 5 7600X
228 fps 0%
AMD Ryzen 5 9600X
228 fps
Intel Core i7-13700
222 fps -3%
Intel Core i7-13700K
222 fps -3%
Intel Core i7-12700
185.6 fps -19%
Intel Core i5-13400
169 fps -26%
Intel Core i5-12400F
155 fps -32%
1920x1080 Badass Overall Quality (DX11)
AMD Ryzen 9 7950X3D
242 fps +35%
AMD Ryzen 7 7800X3D
241 fps +35%
Intel Core i9-14900K
204 fps +14%
AMD Ryzen 9 7950X
186.8 fps +5%
Intel Core i9-13900K
183.7 fps +3%
Intel Core i5-14600K
182 fps +2%
AMD Ryzen 5 7600X
180.6 fps +1%
AMD Ryzen 5 9600X
178.7 fps
Intel Core i7-13700K
172.2 fps -4%
Intel Core i7-13700
168.9 fps -5%
Intel Core i7-12700
141.8 fps -21%
Intel Core i5-13400
128.8 fps -28%
Intel Core i5-12400F
120.6 fps -33%
Far Cry New Dawn
1280x720 Low Preset
AMD Ryzen 7 7800X3D
291 (218min - 442max) fps +29%
AMD Ryzen 9 7950X3D
255 (145min - 381max) fps +13%
Intel Core i9-14900K
235 (156min - 353max) fps +4%
AMD Ryzen 5 9600X
226 (163min - 362max) fps
Intel Core i9-13900K
222 (150min - 335max) fps -2%
Intel Core i5-14600K
216 (168min - 312max) fps -4%
Intel Core i7-13700
203 (144min - 297max) fps -10%
Intel Core i7-13700K
203 (157min - 304max) fps -10%
AMD Ryzen 9 7950X
200 (140min - 302max) fps -12%
AMD Ryzen 5 7600X
199 (140min - 316max) fps -12%
Intel Core i7-12700
174 (103min - 253max) fps -23%
Intel Core i5-13400
159 (110min - 233max) fps -30%
Intel Core i5-12400F
147 (102min - 216max) fps -35%
1920x1080 Ultra Preset
AMD Ryzen 7 7800X3D
226 (154min - 374max) fps +31%
AMD Ryzen 9 7950X3D
199 (131min - 316max) fps +16%
Intel Core i9-14900K
175 (123min - 286max) fps +2%
AMD Ryzen 5 9600X
172 (110min - 289max) fps
Intel Core i9-13900K
166 (116min - 274max) fps -3%
Intel Core i5-14600K
163 (116min - 256max) fps -5%
AMD Ryzen 9 7950X
154 (106min - 252max) fps -10%
Intel Core i7-13700K
153 (108min - 248max) fps -11%
AMD Ryzen 5 7600X
152 (102min - 256max) fps -12%
Intel Core i7-13700
152 (109min - 243max) fps -12%
Intel Core i7-12700
130 (93min - 204max) fps -24%
Intel Core i5-13400
121 (87min - 191max) fps -30%
Intel Core i5-12400F
112 (80min - 173max) fps -35%
Shadow of the Tomb Raider
1280x720 Lowest Preset
AMD Ryzen 7 7800X3D
407 fps +28%
AMD Ryzen 9 7950X3D
383 fps +20%
AMD Ryzen 9 7950X
332 fps +4%
Intel Core i9-14900K
332 fps +4%
AMD Ryzen 5 7600X
321 fps +1%
Intel Core i9-13900K
320 fps 0%
AMD Ryzen 5 9600X
319 fps
Intel Core i5-14600K
281 fps -12%
Intel Core i7-13700
272 fps -15%
Intel Core i7-13700K
272 fps -15%
Intel Core i7-12700
231 fps -28%
Intel Core i5-13400
204 fps -36%
Intel Core i5-12400F
196.4 fps -38%
1920x1080 Highest Preset AA:T
AMD Ryzen 7 7800X3D
375 fps +33%
AMD Ryzen 9 7950X3D
361 fps +28%
Intel Core i9-14900K
313 fps +11%
AMD Ryzen 9 7950X
304 fps +7%
Intel Core i9-13900K
299 fps +6%
AMD Ryzen 5 7600X
294 fps +4%
AMD Ryzen 5 9600X
283 fps
Intel Core i5-14600K
272 fps -4%
Intel Core i7-13700K
257 fps -9%
Intel Core i7-13700
254 fps -10%
Intel Core i7-12700
219 fps -23%
Intel Core i5-13400
188.9 fps -33%
Intel Core i5-12400F
185.1 fps -35%
Tiny Tina's Wonderlands
1920x1080 Low Preset (DX12)
AMD Ryzen 7 7800X3D
506 fps +23%
Intel Core i9-14900K
502 fps +22%
AMD Ryzen 9 7950X3D
477 fps +16%
Intel Core i5-14600K
429 fps +4%
AMD Ryzen 9 7950X
428 fps +4%
AMD Ryzen 5 7600X
415 fps +1%
AMD Ryzen 5 9600X
411 fps
Intel Core i9-13900K
398 fps -3%
Intel Core i7-13700
378 fps -8%
Intel Core i7-13700K
371 fps -10%
Intel Core i7-12700
303 fps -26%
Intel Core i5-13400
275 fps -33%
Intel Core i5-12400F
258 fps -37%
1920x1080 Badass Preset (DX12)
AMD Ryzen 7 7800X3D
309 fps +11%
Intel Core i9-14900K
305 fps +9%
AMD Ryzen 9 7950X3D
299 fps +7%
Intel Core i5-14600K
291 fps +4%
AMD Ryzen 9 7950X
289 fps +4%
AMD Ryzen 5 7600X
282 fps +1%
AMD Ryzen 5 9600X
279 fps
Intel Core i9-13900K
269 fps -4%
Intel Core i7-13700
267 fps -4%
Intel Core i7-13700K
267 fps -4%
Intel Core i7-12700
227 fps -19%
Intel Core i5-13400
207 fps -26%
Intel Core i5-12400F
173.4 fps -38%
Strange Brigade
1280x720 lowest AF:1
AMD Ryzen 5 7600X
780 (275min, 597P1 - 1128max) fps +6%
Intel Core i9-14900K
762 (261min, 605P1 - 1027max) fps +4%
AMD Ryzen 7 7800X3D
760 (257min, 602P1 - 1084max) fps +3%
AMD Ryzen 5 9600X
735 (154.9min, 595P1 - 998max) fps
Intel Core i5-14600K
717 (186min, 554P1 - 1036max) fps -2%
AMD Ryzen 9 7950X
698 (182.7min, 569P1 - 937max) fps -5%
Intel Core i9-13900K
691 (60.2min, 543P1 - 929max) fps -6%
AMD Ryzen 9 7950X3D
672 (259min, 529P1 - 894max) fps -9%
Intel Core i7-13700K
646 (277min, 510P1 - 858max) fps -12%
Intel Core i7-13700
626 (284min, 497P1 - 830max) fps -15%
Intel Core i7-12700
523 (243min, 410P1 - 698max) fps -29%
Intel Core i5-12400F
444 (33.1min, 345P1 - 648max) fps -40%
Intel Core i5-13400
408 (153.5min, 319P1 - 565max) fps -44%
1920x1080 ultra AA:ultra AF:16
Intel Core i9-14900K
602 (130.1min, 454P1 - 837max) fps +3%
AMD Ryzen 5 7600X
595 (60.2min, 433P1 - 847max) fps +2%
AMD Ryzen 7 7800X3D
589 (117.1min, 448P1 - 825max) fps +1%
AMD Ryzen 5 9600X
586 (114.9min, 457P1 - 781max) fps
AMD Ryzen 9 7950X
565 (104.9min, 433P1 - 773max) fps -4%
Intel Core i9-13900K
553 (60min, 407P1 - 743max) fps -6%
Intel Core i5-14600K
546 (131.9min, 403P1 - 789max) fps -7%
AMD Ryzen 9 7950X3D
524 (115.8min, 393P1 - 718max) fps -11%
Intel Core i7-13700K
511 (60min, 383P1 - 689max) fps -13%
Intel Core i7-13700
499 (60.1min, 381P1 - 674max) fps -15%
Intel Core i7-12700
404 (39.3min, 300P1 - 537max) fps -31%
Intel Core i5-12400F
346 (59.3min, 265P1 - 470max) fps -41%
Intel Core i5-13400
312 (60.1min, 239P1 - 432max) fps -47%
Metro Exodus
1280x720 Low Quality AF:4x
AMD Ryzen 7 7800X3D
374 (214.41min - 571.76max) fps +7%
AMD Ryzen 5 9600X
349 (182.25min - 551.57max) fps
Intel Core i9-14900K
319 (166.53min - 527.7max) fps -9%
AMD Ryzen 5 7600X
309 (157.23min - 500.25max) fps -11%
AMD Ryzen 9 7950X
300 (162.95min - 476.42max) fps -14%
Intel Core i5-14600K
296 (170.68min - 455.17max) fps -15%
AMD Ryzen 9 7950X3D
293 (157.18min - 462.11max) fps -16%
Intel Core i7-13700
268 (127.73min - 445.04max) fps -23%
Intel Core i9-13900K
261 (116.81min - 454.13max) fps -25%
Intel Core i7-13700K
261 (117.16min - 442.09max) fps -25%
Intel Core i7-12700
233 (124.52min - 364.56max) fps -33%
Intel Core i5-12400F
203 (112.65min - 299.76max) fps -42%
Intel Core i5-13400
196.9 (110.05min - 286.04max) fps -44%
1920x1080 Ultra Quality AF:16x
AMD Ryzen 7 7800X3D
219 (104.41min - 354.23max) fps 0%
AMD Ryzen 5 9600X
218 (90.41min - 345.54max) fps
Intel Core i9-14900K
214 (96.03min - 351.12max) fps -2%
Intel Core i5-14600K
202 (100.6min - 297.35max) fps -7%
AMD Ryzen 9 7950X
201 (109.06min - 313.19max) fps -8%
AMD Ryzen 5 7600X
197.7 (103.17min - 305.72max) fps -9%
AMD Ryzen 9 7950X3D
193.5 (110.2min - 306.94max) fps -11%
Intel Core i9-13900K
191.8 (89.7min - 336.25max) fps -12%
Intel Core i7-13700
181.8 (91.32min - 283.37max) fps -17%
Intel Core i7-13700K
180.5 (90.82min - 282.73max) fps -17%
Intel Core i7-12700
157.1 (88.03min - 235.4max) fps -28%
Intel Core i5-13400
144 (81.05min - 208.64max) fps -34%
Intel Core i5-12400F
141.8 (80.39min - 206.57max) fps -35%
F1 2020
1280x720 Ultra Low Preset
AMD Ryzen 7 7800X3D
681 (531min - 769max) fps +8%
AMD Ryzen 5 9600X
630 (468min - 710max) fps
Intel Core i9-14900K
598 (473min - 679max) fps -5%
AMD Ryzen 9 7950X3D
594 (461min - 653max) fps -6%
AMD Ryzen 9 7950X
563 (437min - 628max) fps -11%
AMD Ryzen 5 7600X
559 (420min - 634max) fps -11%
Intel Core i9-13900K
526 (418min - 596max) fps -17%
Intel Core i7-13700K
465 (325min - 539max) fps -26%
Intel Core i7-13700
461 (323min - 528max) fps -27%
Intel Core i5-14600K
403 (333min - 436max) fps -36%
Intel Core i7-12700
388 (314min - 434max) fps -38%
Intel Core i5-12400F
322 (266min - 345max) fps -49%
Intel Core i5-13400
292 (253min - 317max) fps -54%
1920x1080 Ultra High Preset AA:T AF:16x
AMD Ryzen 7 7800X3D
503 (411min - 597max) fps +12%
AMD Ryzen 9 7950X3D
453 (358min - 537max) fps +1%
Intel Core i9-14900K
450 (365min - 547max) fps 0%
AMD Ryzen 5 9600X
450 (340min - 527max) fps
AMD Ryzen 5 7600X
413 (330min - 498max) fps -8%
AMD Ryzen 9 7950X
412 (319min - 486max) fps -8%
Intel Core i9-13900K
388 (310min - 464max) fps -14%
Intel Core i5-14600K
373 (297min - 426max) fps -17%
Intel Core i7-13700K
369 (251min - 430max) fps -18%
Intel Core i7-13700
361 (300min - 429max) fps -20%
Intel Core i7-12700
311 (217min - 362max) fps -31%
Intel Core i5-12400F
262 (215min - 299max) fps -42%
Intel Core i5-13400
233 (192min - 268max) fps -48%
F1 2021
1280x720 Ultra Low Preset
AMD Ryzen 7 7800X3D
830 (632min, 515P1 - 919max) fps +24%
Intel Core i9-14900K
733 (560min, 450P1 - 806max) fps +10%
AMD Ryzen 5 7600X
690 (453min, 397P1 - 783max) fps +3%
AMD Ryzen 9 7950X3D
682 (522min, 418P1 - 767max) fps +2%
AMD Ryzen 9 7950X
677 (504min, 418P1 - 754max) fps +1%
AMD Ryzen 5 9600X
669 (451min, 412P1 - 741max) fps
Intel Core i9-13900K
599 (469min, 379P1 - 653max) fps -10%
Intel Core i7-13700K
588 (466min, 371P1 - 639max) fps -12%
Intel Core i7-13700
572 (447min, 359P1 - 620max) fps -14%
Intel Core i5-14600K
562 (468min, 364P1 - 618max) fps -16%
Intel Core i7-12700
448 (363min, 297P1 - 477max) fps -33%
Intel Core i5-12400F
393 (309min, 274P1 - 416max) fps -41%
Intel Core i5-13400
337 (277min, 237P1 - 358max) fps -50%
1920x1080 Ultra High Preset + Raytracing AA:T AF:16x
AMD Ryzen 7 7800X3D
369 (301min, 276P1 - 395max) fps +32%
Intel Core i9-14900K
307 (260min, 234P1 - 327max) fps +10%
AMD Ryzen 5 9600X
280 (231min, 211P1 - 307max) fps
Intel Core i5-14600K
278 (237min, 198P1 - 299max) fps -1%
AMD Ryzen 5 7600X
277 (233min, 216P1 - 298max) fps -1%
Intel Core i9-13900K
273 (232min, 214P1 - 292max) fps -2%
AMD Ryzen 9 7950X
271 (224min, 205P1 - 294max) fps -3%
AMD Ryzen 9 7950X3D
271 (216min, 208P1 - 293max) fps -3%
Intel Core i7-13700K
261 (218min, 194P1 - 278max) fps -7%
Intel Core i7-13700
256 (214min, 191P1 - 272max) fps -9%
Intel Core i7-12700
221 (188min, 156P1 - 233max) fps -21%
Intel Core i5-12400F
204 (166min, 150P1 - 218max) fps -27%
Intel Core i5-13400
189 (158min, 136P1 - 204max) fps -32%

AMD Ryzen 5 9600X with Nvidia GeForce RTX 4090

baixomédiaaltoultraQHD4K DLSS4K
GTA V (2015) 188.1 187.9 187.8 166.3 166.7 187.7
The Witcher 3 (2015) 762 685 590 286 250 277
Dota 2 Reborn (2015) 291 264 253 233 225
Final Fantasy XV Benchmark (2018) 237 234 229 215 150.9
X-Plane 11.11 (2018) 245 219 166.1 136.6
Far Cry 5 (2018) 263 231 223 203 203 170
Strange Brigade (2018) 735 598 593 586 527 286
Shadow of the Tomb Raider (2018) 319 296 287 283 267 188.1
Far Cry New Dawn (2019) 226 203 194 172 171 148
Metro Exodus (2019) 349 300 262 218 194.4 138
Anno 1800 (2019) 177.9 164.1 135 67 62.6 61.3
Total War: Three Kingdoms (2019) 638 370 285 246 195 102
Borderlands 3 (2019) 228 198.4 185.8 178.7 171.6 131.8
F1 2020 (2020) 630 518 507 450 421 287
F1 2021 (2021) 669 607 565 280 276 205
Tiny Tina's Wonderlands (2022) 411 350 309 279 223 130
F1 22 (2022) 439 425 411 202 162.7 85
Returnal (2023) 189 190 182 183 171 113
F1 23 (2023) 419 459 422 192.9 155.3 134.1 81.1
Baldur's Gate 3 (2023) 253 231 211 212 191.9 177.2 127.5
Cyberpunk 2077 2.1 Phantom Liberty (2023) 256 252 231 204 153.4 75.6
Assassin's Creed Mirage (2023) 186 208 168 127 120 133 101
Total War Pharaoh (2023) 471 287 189 155 154 146
Avatar Frontiers of Pandora (2023) 244 229 203 169 125 113 69
Helldivers 2 (2024) 182.8 175.1 174.3 173 174 137.5
Skull & Bones (2024) 156 154 152 146 138 133 99
F1 24 (2024) 405 421 401 205 149.6 128.6 80.5

Consumo de energia - o Zen 5 não é apenas rápido, mas também muito econômico

Quando se trata de consumo de energia, a AMD já superou sua concorrente Intel com seus modelos Ryzen 7000 e demonstrou a eficiência com que eles podem funcionar. Acima de tudo, a AMD conseguiu mais uma vez aumentar drasticamente a eficiência de seus modelos X3D. Ao tomar a iniciativa de fabricar os processadores Zen 5 usando o processo de 4 nm, a AMD conseguiu reduzir o consumo de energia em comparação com seus antecessores diretos. O AMD Ryzen 5 9600X é classificado em até 88 watts (PPT), enquanto o AMD Ryzen 5 7600X ainda era capaz de consumir até 142 watts. Na comparação de eficiência, o AMD Ryzen 5 9600X estava no mesmo nível do AMD Ryzen 7 7800X3D e de um Intel Core i5-13400. Nossa amostra de teste venceu claramente o duelo com o Intel Core i5-14600K. Definitivamente, a Intel precisa fazer melhorias aqui com seus próximos processadores para desktop.

Felizmente, a unidade de resfriamento não precisa ser tão grande. Um bom resfriador a ar, combinado com uma boa ventilação do gabinete, é suficiente para resfriar de forma confiável o AMD Ryzen 5 9600X. Com nosso sistema de resfriamento superdimensionado, o processador só aqueceu até um pouco menos de 63 °C.

Observação sobre o Eco Mode:

Essa opção está no BIOS e também pode ser ativada. No entanto, ela não tem efeito sobre o consumo de energia do processador. Quando perguntamos, fomos informados de que o modo Eco é voltado principalmente para processadores com uma classificação TDP mais alta. Isso significa que simplesmente não há modo Eco em combinação com o AMD Ryzen 5 9600X. Como alternativa, o TDP e o PPT podem ser ajustados manualmente no BIOS. Como a AMD não fez nenhuma especificação oficial aqui, nós nos abstivemos de testá-lo com um consumo de energia reduzido.

Teste de estresse - Prime95 solo

Efficiency overview

Power Consumption / Cinebench R23 Single Power Efficiency - external Monitor
Ryzen 5 9600X
15.2 Points per Watt
i5-14600K
13.8 Points per Watt -9%
R7 7800X3D
9.54 Points per Watt -37%
Power Consumption / Cinebench R23 Multi Power Efficiency - external Monitor
R7 7800X3D
89.1 Points per Watt +8%
Ryzen 5 9600X
82.2 Points per Watt
i5-14600K
73.8 Points per Watt -10%
Power Consumption / Cinebench R15 Multi Efficiency (external Monitor)
R7 7800X3D
14.4 Points per Watt +15%
Ryzen 5 9600X
12.5 Points per Watt
R5 7600X
11.7 Points per Watt -6%
i5-14600K
11.1 Points per Watt -11%
Performance Rating - Percent
AMD Ryzen 5 9600X
61 pt
AMD Ryzen 7 7800X3D
60.8 pt
Intel Core i5-13400
60.7 pt
Intel Core i5-12400F
60 pt
AMD Ryzen 5 7600X
59.2 pt
AMD Ryzen 9 7950X3D
49.4 pt
Intel Core i7-12700
43.6 pt
Intel Core i5-14600K
35.5 pt
Intel Core i7-13700K
34.2 pt
Intel Core i7-13700
30.8 pt
Intel Core i9-14900K
0 pt
Power Consumption
Cinebench R15 Multi (external Monitor)
Intel Core i9-14900K
548 (545min, 545P1 - 551max) Watt * -161%
Intel Core i7-13700
365 (363min, 363P1 - 367max) Watt * -74%
Intel Core i7-13700K
357 (356min, 356P1 - 362max) Watt * -70%
Intel Core i5-14600K
329 (323min, 324P1 - 331max) Watt * -57%
Intel Core i7-12700
284 (282min, 282P1 - 287max) Watt * -35%
AMD Ryzen 9 7950X3D
273 (264min, 264P1 - 304max) Watt * -30%
AMD Ryzen 5 7600X
215 (134.8min, 135.6P1 - 259max) Watt * -2%
AMD Ryzen 5 9600X
210 (209min, 209P1 - 210max) Watt *
AMD Ryzen 7 7800X3D
207 (203min, 203P1 - 216max) Watt * +1%
Intel Core i5-13400
196.6 (194.6min, 194.6P1 - 207max) Watt * +6%
Intel Core i5-12400F
194.4 (192.3min, 192.3P1 - 200max) Watt * +7%
Prime95 V2810 Stress (external Monitor)
Intel Core i9-14900K
537 (508min, 510P1 - 606max) Watt * -152%
Intel Core i7-13700
386 (363min, 364P1 - 487max) Watt * -81%
Intel Core i5-14600K
370 (349min, 349P1 - 422max) Watt * -74%
Intel Core i7-13700K
357 (341min, 342P1 - 458max) Watt * -68%
Intel Core i7-12700
327 (304min, 305P1 - 394max) Watt * -54%
AMD Ryzen 9 7950X3D
276 (267min, 267P1 - 329max) Watt * -30%
Intel Core i5-12400F
239 (225min, 226P1 - 252max) Watt * -12%
Intel Core i5-13400
229 (224min, 224P1 - 247max) Watt * -8%
AMD Ryzen 5 7600X
227 (218min, 219P1 - 245max) Watt * -7%
AMD Ryzen 7 7800X3D
218 (214min, 215P1 - 223max) Watt * -2%
AMD Ryzen 5 9600X
213 (207min, 208P1 - 220max) Watt *

* ... menor é melhor
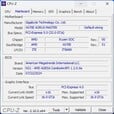
Power consumption with external monitor

03570105140175210245280315350385420455490525560595Tooltip
AMD Ryzen 5 9600X; Idle 1min (external Monitor): Ø117.7 (111.9-125.8)
AMD Ryzen 5 9600X; 1280x720 Prime95 28.10 and Furmark 1.25: Ø388 (286-629)
AMD Ryzen 5 9600X; Cyberpunk 2077 FHD ultra no FSR (external Monitor): Ø561 (548-570)
AMD Ryzen 5 9600X; 3DMark06 Return To Proxycon: Ø194.7 (172.2-223)

Power consumption with external monitor

03570105140175210245280315350385420455490525560595Tooltip
AMD Ryzen 5 9600X; Prime95 V2810 Stress (external Monitor): Ø213 (207-220)
AMD Ryzen 5 9600X; Cinebench R15 Multi (external Monitor): Ø210 (209-210)
AMD Ryzen 5 9600X; Cinebench R23 Single (external Monitor): Ø143.5 (139.1-160.8)
AMD Ryzen 5 9600X; Cinebench R23 Multi (external Monitor): Ø209 (208-210)
AMD Ryzen 5 9600X; 1280x720 FurMark 1.19 GPU Stress Test (external Monitor): Ø576 (559-619)

Pro

+ excelente desempenho de núcleo único
+ bom desempenho em jogos
+ produção em 4 nm
+ muito eficiente em termos de energia
+ fácil de transferir
+ Suporte a PCI-Express-5.0
+ compatível com as placas-mãe atuais após a atualização do BIOS

Contra

- sem modo Eco

Veredicto - O Ryzen 5 9600X é a CPU de 6 núcleos mais rápida da AMD

O AMD Ryzen 5 9600X analisado: amostra de teste fornecida pela AMD Alemanha.

Quase dois anos depois de apresentar a plataforma AM5 e os processadores Ryzen 7000, a AMD lançou seus novos processadores Ryzen 9000. Graças à sua nova arquitetura Zen 5, eles oferecem mais desempenho com um consumo de energia consideravelmente menor - em termos de sustentabilidade, esse é certamente um grande passo na direção certa. Ao contrário da Intel, que sempre tentou obter o máximo de desempenho possível de seus processadores com a ajuda de fontes de alimentação cada vez maiores, a AMD não perdeu a noção de eficiência.

O Ryzen 5 9600X é atualmente o processador de 6 núcleos mais rápido da AMD. O fabricante não deixou de lado o SMT (Simultaneous Multithreading), de modo que doze unidades lógicas de computação cuidam das tarefas em questão. Em suma, o AMD Ryzen 5 9600X dominou nosso curso de benchmark de forma excelente. A maior vantagem da arquitetura Zen 5 é o aumento do IPC. Em muitos testes de núcleo único, ele frequentemente conseguiu atingir o desempenho de um Intel Core i9-14900K. Isso é bastante notável e mostra o potencial desses processadores. A Intel também tem problemas graves com a estabilidade de seus processadores de 13ª e 14ª gerações, o que também favorece a AMD neste momento.

O AMD Ryzen 5 9600X apresenta um desempenho de núcleo único extremamente aprimorado. O desempenho resultante em jogos é, às vezes, até melhor do que o Intel Core i5-14600K.

A produção menor de 4 nm torna esse aumento de desempenho possível com um consumo de energia menor. Isso resulta em outras vantagens, como soluções de resfriamento menores e mais baratas. O uso em sistemas mini-ITX compactos também pode ser possível.

Para quem o AMD Ryzen 5 9600X é a CPU certa? É difícil responder a essa pergunta, pois a concorrência vem da mesma empresa e é chamada de AMD Ryzen 7 7800X3D. Dois núcleos físicos a mais e melhor desempenho em jogos falam a favor do processador X3D mais antigo. Portanto, a AMD só pode marcar pontos com o Ryzen 5 9600X com seu preço atraente.

Preço e disponibilidade

O MRSP oficial da AMD para o AMD Ryzen 5 9600X é de US$ 279. O senhor pode ver todos os componentes disponíveis da AMD na loja da Amazon.

Transparência

A seleção dos dispositivos a serem analisados ​​é feita pela nossa equipe editorial. A amostra de teste foi fornecida ao autor como empréstimo pelo fabricante ou varejista para fins desta revisão. O credor não teve influência nesta revisão, nem o fabricante recebeu uma cópia desta revisão antes da publicação. Não houve obrigação de publicar esta revisão. Nunca aceitamos compensação ou pagamento em troca de nossas avaliações. Como empresa de mídia independente, a Notebookcheck não está sujeita à autoridade de fabricantes, varejistas ou editores.

É assim que o Notebookcheck está testando

Todos os anos, o Notebookcheck analisa de forma independente centenas de laptops e smartphones usando procedimentos padronizados para garantir que todos os resultados sejam comparáveis. Desenvolvemos continuamente nossos métodos de teste há cerca de 20 anos e definimos padrões da indústria no processo. Em nossos laboratórios de teste, equipamentos de medição de alta qualidade são utilizados por técnicos e editores experientes. Esses testes envolvem um processo de validação em vários estágios. Nosso complexo sistema de classificação é baseado em centenas de medições e benchmarks bem fundamentados, o que mantém a objetividade.
Please share our article, every link counts!
Mail Logo
> Análises e revisões de portáteis e celulares > Análises > Análises > Análise: A CPU para desktop Ryzen 5 9600X da AMD faz com que as CPUs Raptor Lake da Intel pareçam antigas graças à eficiente arquitetura Zen 5
Sebastian Bade, 2024-08- 9 (Update: 2024-08- 9)